|
Currency
|
Last
|
High
|
Low
|
Daily Change (pip)
|
Daily Range (pip)
|
|
USD/CAD
|
1.3379
|
1.3431
|
1.3342
|
34
|
89
|
USD/CAD Daily
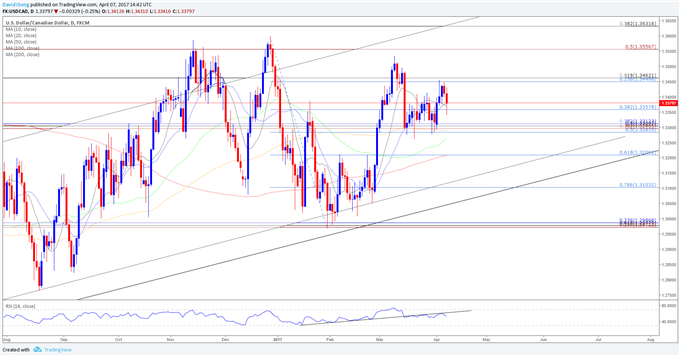
Chart – Created Using Trading View
USD/CAD continues to give back the advance from earlier this month as Canada Employment exceeds market expectations, with the region adding another 19.4K jobs in March, while U.S. Non-Farm Payrolls (NFP) increased 98K during the same period amid forecasts for a 180K expansion.
The failed attempt to break/close above the Fibonacci overlap around 1.3450 (23.6% retracement) to 1.3460 (61.8% retracement) shifts the near-term outlook towards the downside especially as USD/CAD initiates a series of lower highs & lows; will continue to monitor the developments in the Relative Strength Index (RSI) as former trendline support appears to be offering resistance.
The uptick in the Labor Force Participation Rate accompanied by the ongoing pickup in full-time positions may put increased pressure on the Bank of Canada (BoC) to lift the benchmark interest rate off of the record-low, but Governor Stephen Poloz may continue to endorse a wait-and-see approach at the meeting on April 12 as the central bank head warns normalizing monetary policy prematurely would push the economy back into recession; in turn, more of the same from Poloz & Co. may dampen the appeal of the Canadian dollar as it drags on interest-rate expectations.
Broader outlook for USD/CAD remains constructive as it preserves the upward trend carried over from the previous year, but the lack of momentum to test the 2017-high (1.3535) may spark a move back towards the Fibonacci overlap around 1.3280 (50% retracement) to 1.3310 (38.2% retracement), which largely lines up with the April low (1.3295).
|
Currency
|
Last
|
High
|
Low
|
Daily Change (pip)
|
Daily Range (pip)
|
|
GBP/USD
|
1.2395
|
1.2478
|
1.2382
|
75
|
96
|


Leave A Comment