Yesterday, the U.S. dollar moved sharply lower against its Canadian counterpart, which took the exchange rate to our next downside target. Thanks to the seller’s attack, we noticed a potential pro-bearish formation on the horizon, which can make positions even more profitable…
EUR/USD – Breakdowns and Their Implications

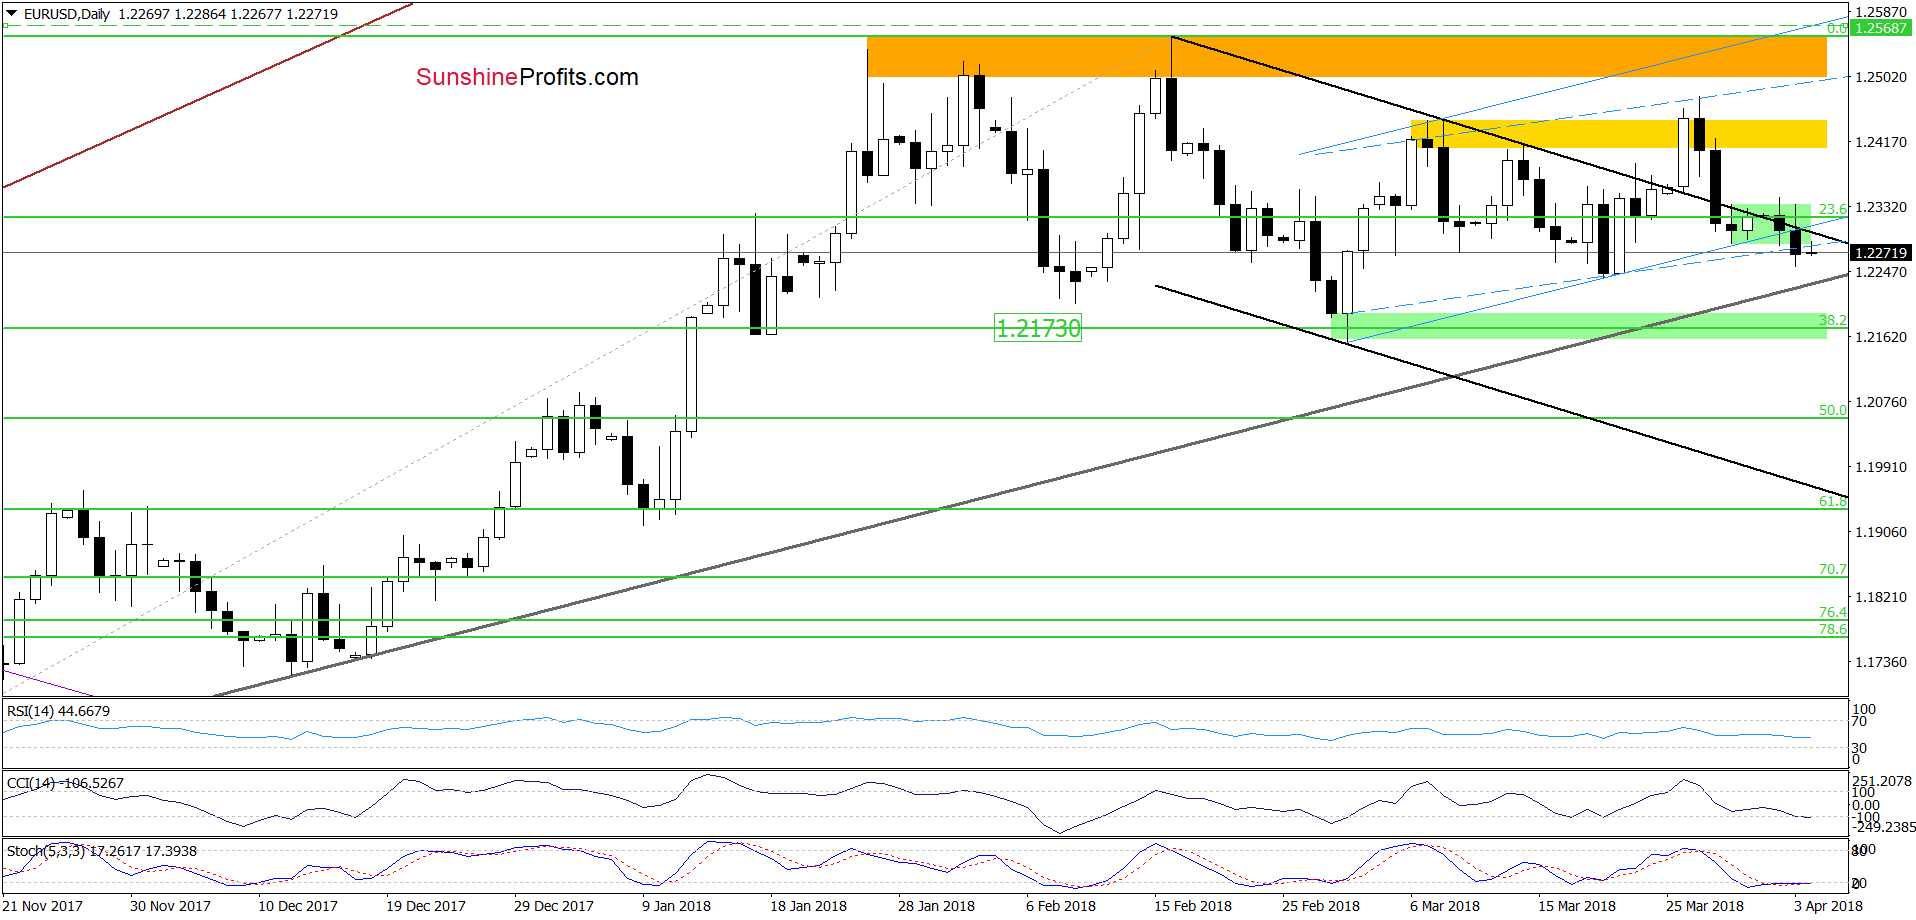
Yesterday, we wrote that although EUR/USD came back above the previously-broken upper border of the black declining trend channel, the pair is still trading inside the green consolidation slightly below the 23.6% Fibonacci retracement.
What does it mean for the exchange rate? In our opinion, as long as there is no daily closure above the upper line of the formation and the black support/resistance line another move to the downside and a test of the green support zone is likely.
From today’s point of view, we see that currency bears didn’t disappoint us and pushed EUR/USD lower, invalidating the earlier tiny breakout above the upper border of the black declining trend channel during Tuesday’s session.
Thanks to yesterday’s drop the pair also closed the day under the lower line of the green consolidation and the lower border of the blue rising trend channel (not only in terms of intraday lows, but also in terms of daily openings), which doesn’t bode well for currency bulls – even if we factor in the fact that the daily indicators are oversold (as a reminder, they have lied many times in the past).
What’s next for the exchange rate?
Taking all the above into account, we think that the pair will test not only the medium-term support line based on the November and December 2017 lows, but also the 38.2% Fibonacci retracement and the green support zone in the coming day(s).
USD/JPY vs. Short-term Resistance

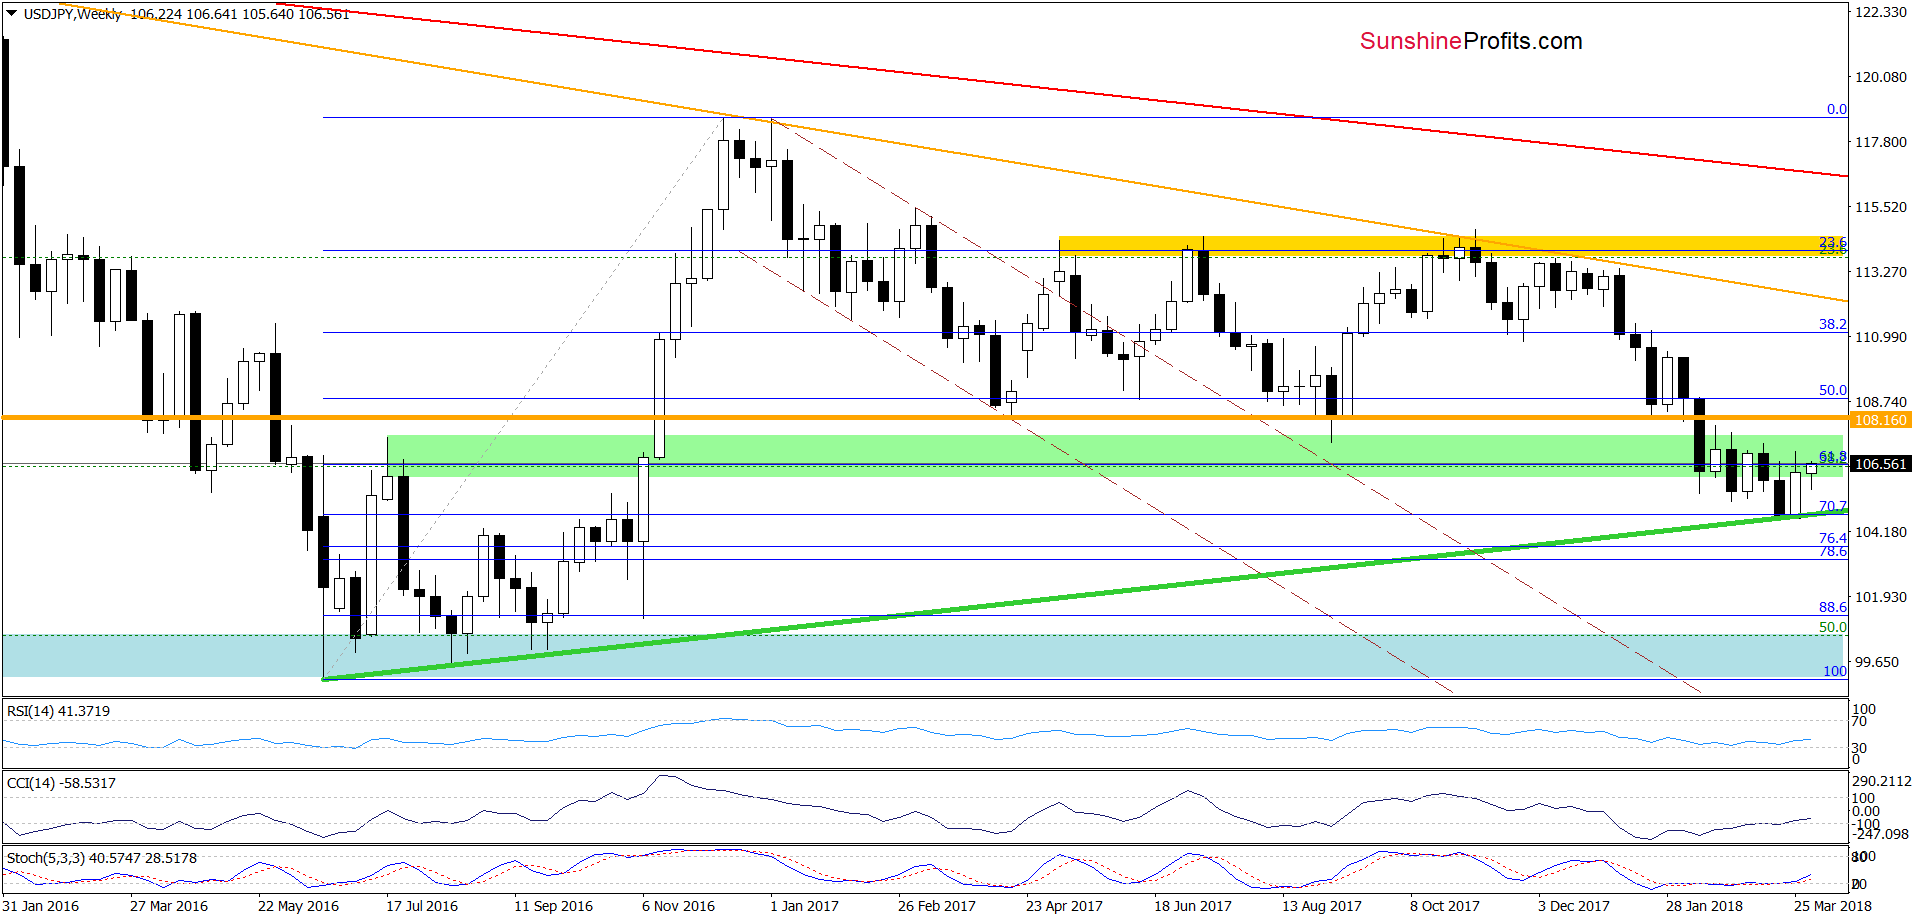
Looking at the weekly chart, we see that although USD/JPY pulled back in the previous week, currency bulls didn’t give up and try to push the pair higher this week. The buy signals generated by the indicators suggest further improvement, but will we see a bigger move to the upside?


Leave A Comment