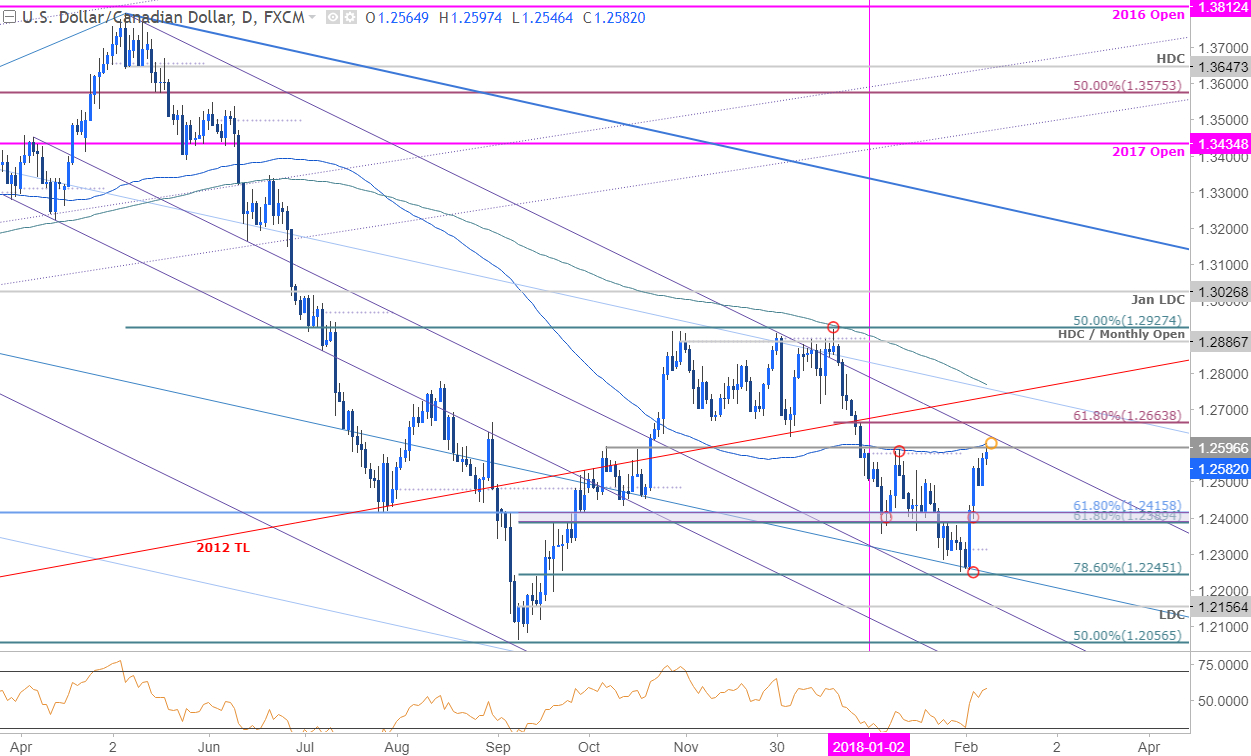
USDCAD broke above near-term downslope resistance late last week with the subsequent rally now approaching initial resistance targets. The focus remains higher while above near-term structural support but heading into tomorrow’s Canada Employment report, the immediate upside bias may be at risk.
USD/CAD DAILY PRICE CHART

Technical Outlook: In my analyst pick earlier this week I noted that a USD/CAD, “breakout of a near-term descending channel formation has fueled a rally in the pair with advance now approaching a key area of near-term resistance at 1.2579-1.26. This region is defined by the 2018 open, the 38.2% retracement & the 100-day moving average and converges on the 50-line of this near-term ascending pitchfork.”
Price is now testing this level as resistance as daily momentum struggles to mount 60. The immediate long-bias may be vulnerable while below this level near-term. A breach / daily close above this resistance threshold would constitute a break of the monthly opening-range and would be needed to keep the long-bias intact.
USD/CAD 240MIN PRICE CHART

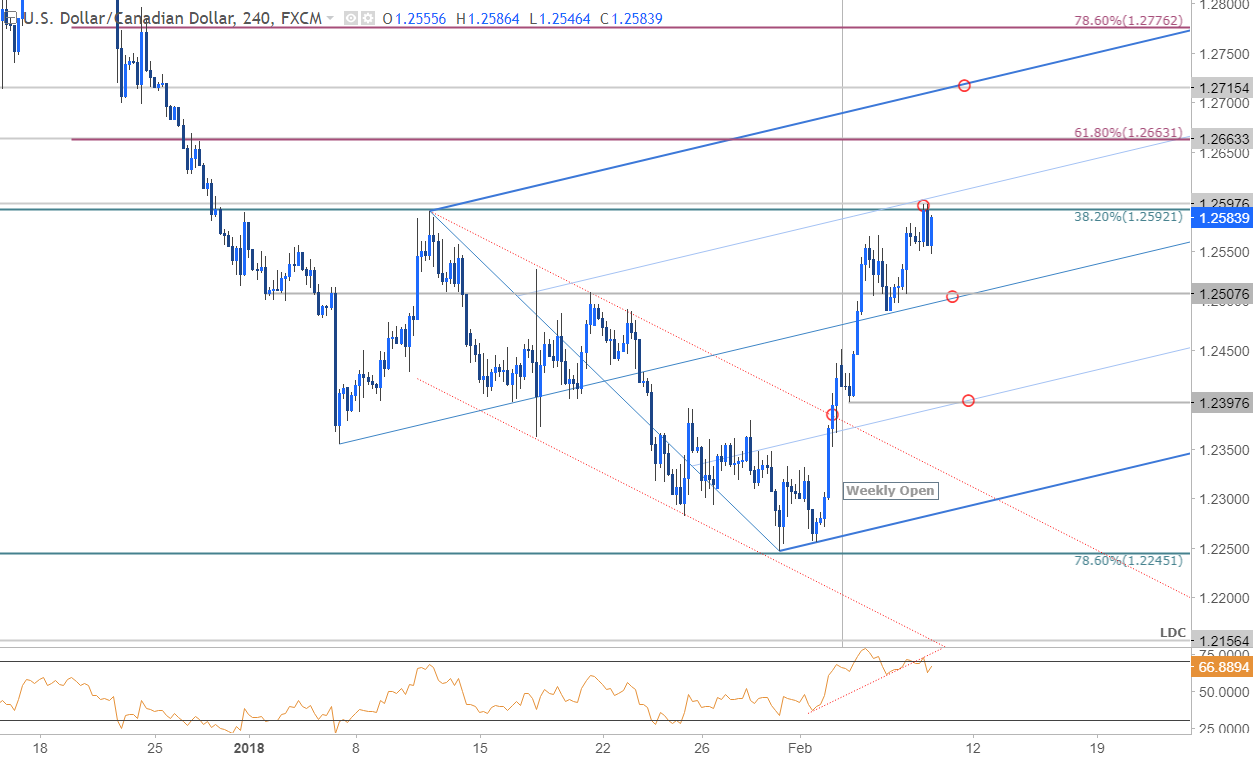
Notes: A closer look at price action sees Loonie trading within the confines of an ascending pitchfork formation extending off the January lows with the rally now resting confluence resistance around the 1.26-handle. A breach above this threshold (daily close) would keep the long-bias in play targeting the 61.8% retracement at 1.2663 backed by the upper median-line parallel around ~1.2715.
Interim support rests at the median-line / 1.2500/07 with a break below this level risking a larger setback towards the weekly opening-range lows / lower 50-line at 1.2398. Bottom line: USD/CAD is testing a near-term inflection point and we’ll be looking for a definitive reaction tomorrow to offer further guidance. From a trading standpoint, I’ll favor fading strength tomorrow should price spike into the upper parallel OR look to short bounces with a break below the median-line / 1.25.


Leave A Comment