USD/JPY
4 hour
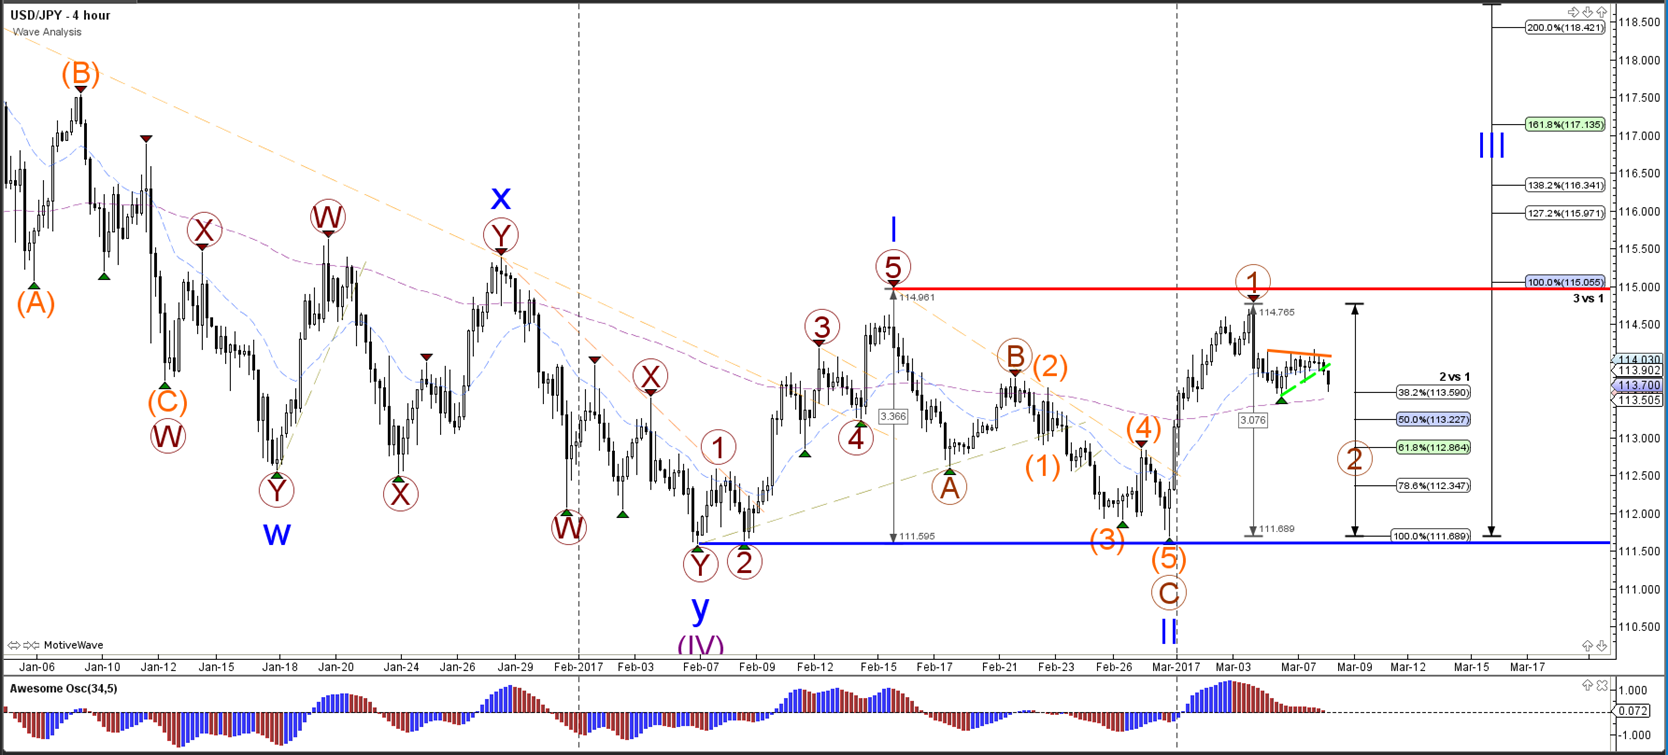
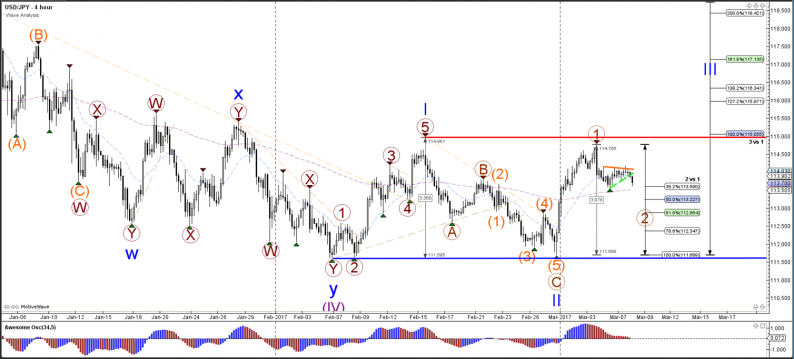
The USD/JPY seems to be retracing within a wave 2 (brown) back to the Fibonacci levels which could act as support. The wave 1-2 (brown) structure is invalidated once price breaks below the bottom (blue).
1 hour
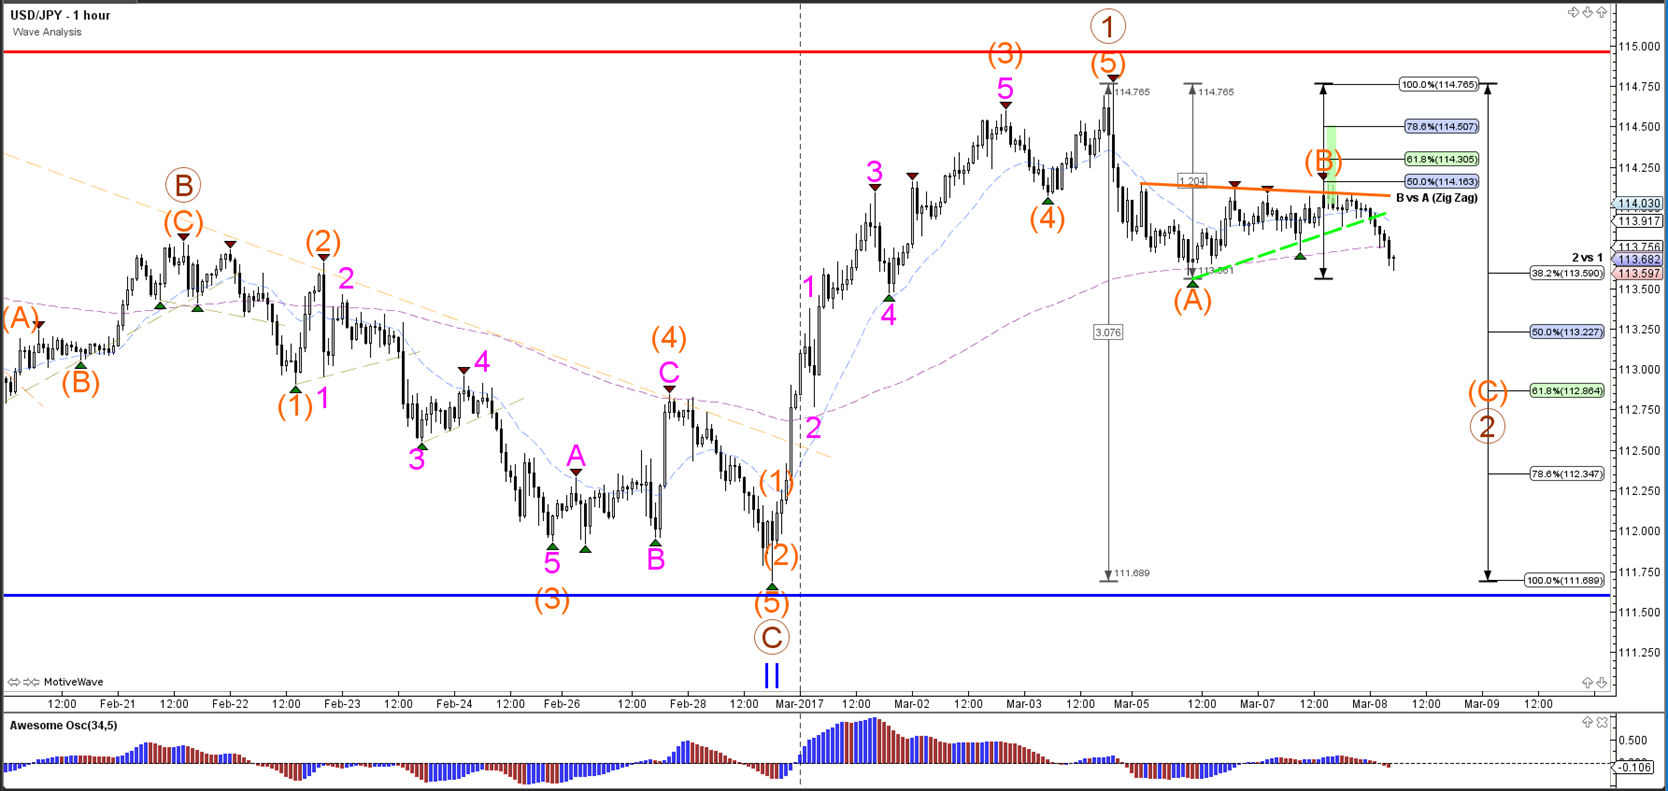
The USD/JPY is building an ABC (orange) within wave 2 (brown) and could retrace back to the Fibonacci levels of wave 2 vs 1 (brown).
EUR/USD
4 hour
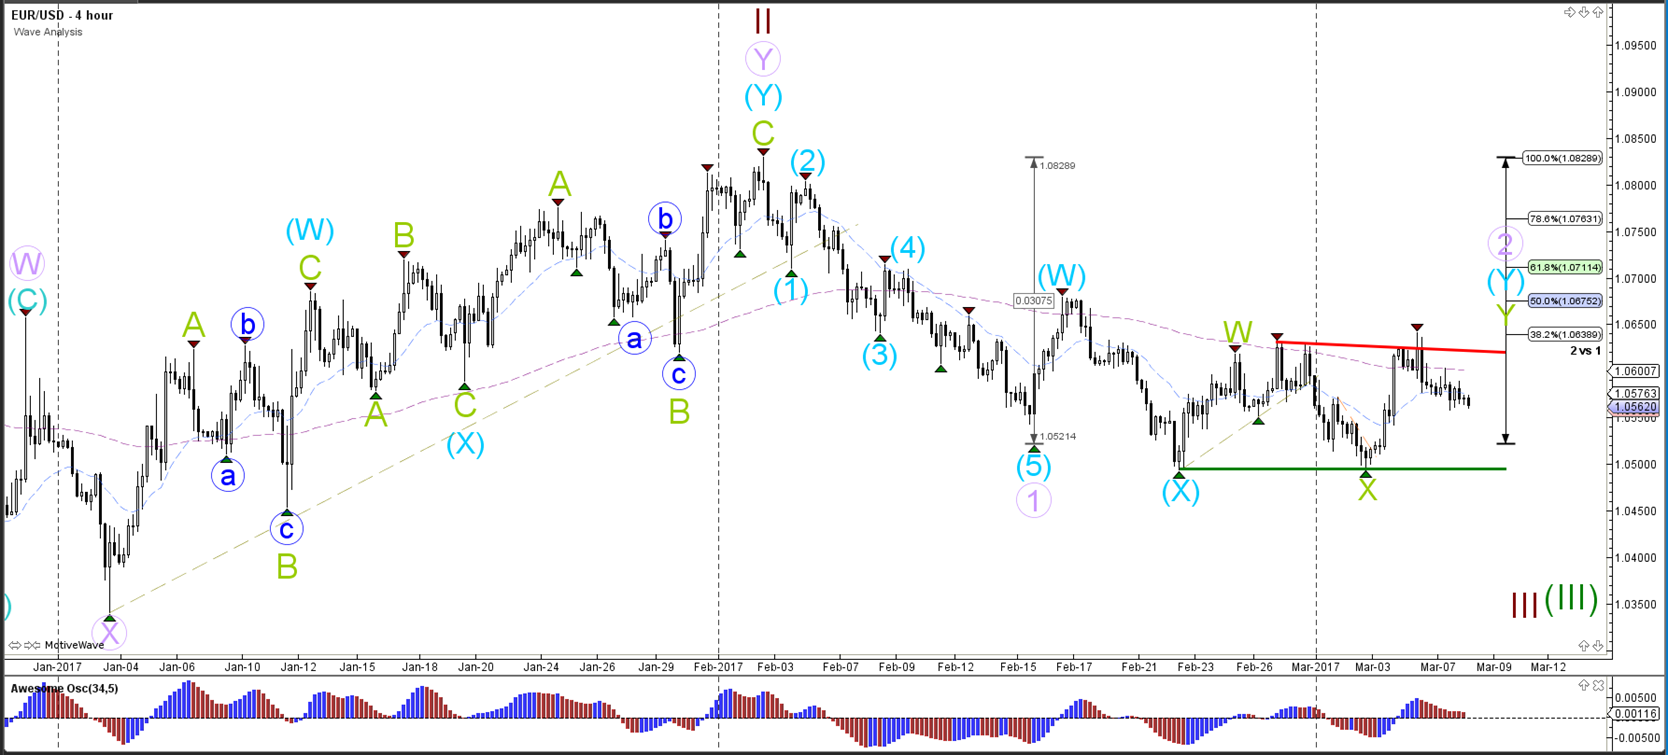
The EUR/USD remains between a support (green) and resistance trend line (red), which mark the borders of the corrective zone. A break above resistance (red) could see price move higher to test the Fibonacci levels of wave 2 (purple) but a push above the 100% level invalidates the wave structure. A break below support (green) could see the downtrend continue within waves 3 (red/green).
1 hour
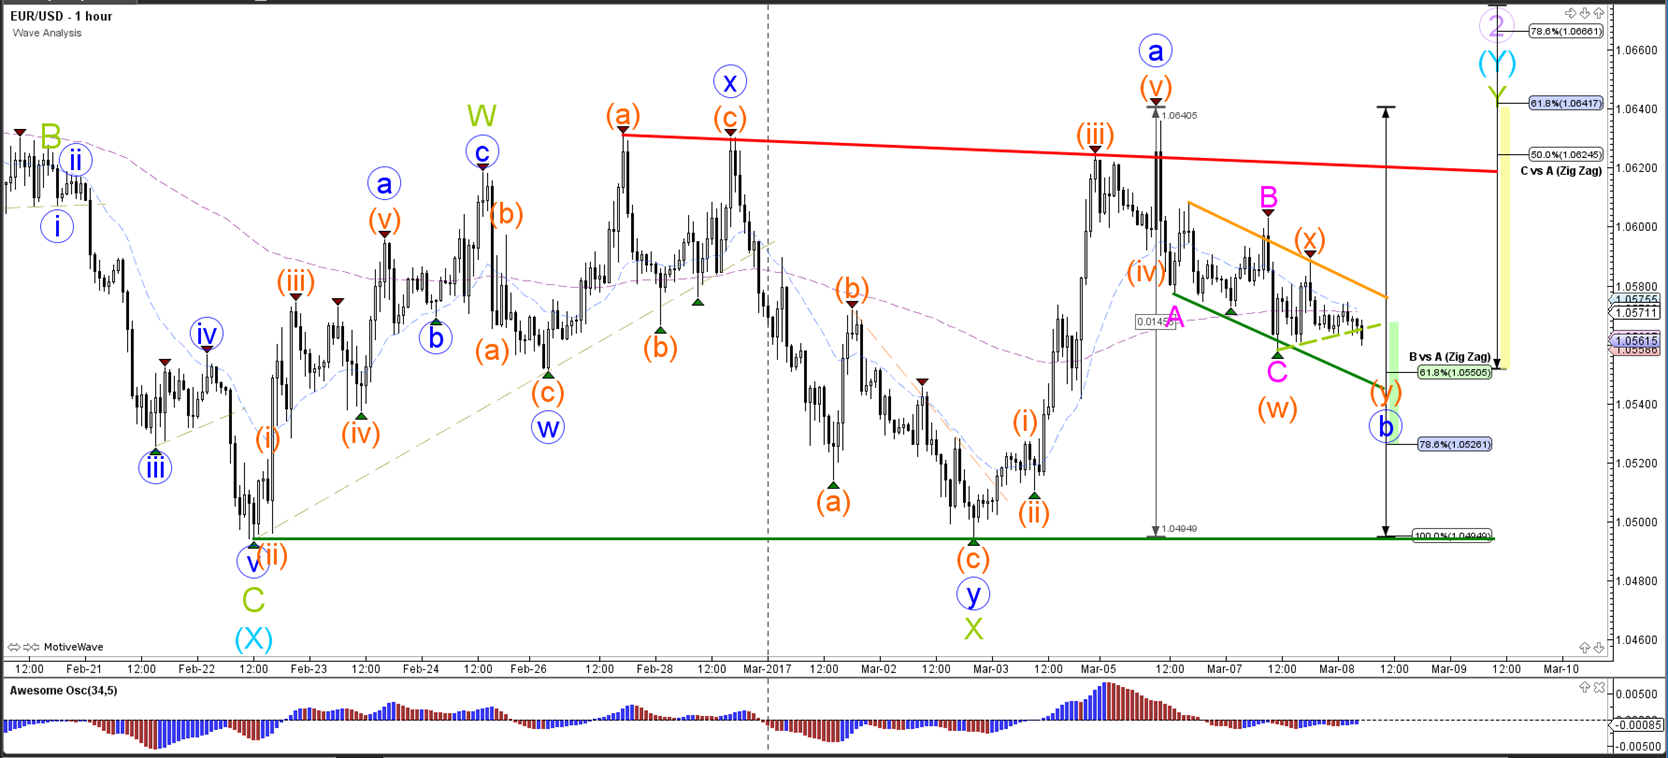
The EUR/USD is moving lower in a choppy and corrective way, which makes it likely that price is retracing within a wave B (blue). The invalidation spot of this wave B (blue) is the bottom (green)
GBP/USD
4 hour
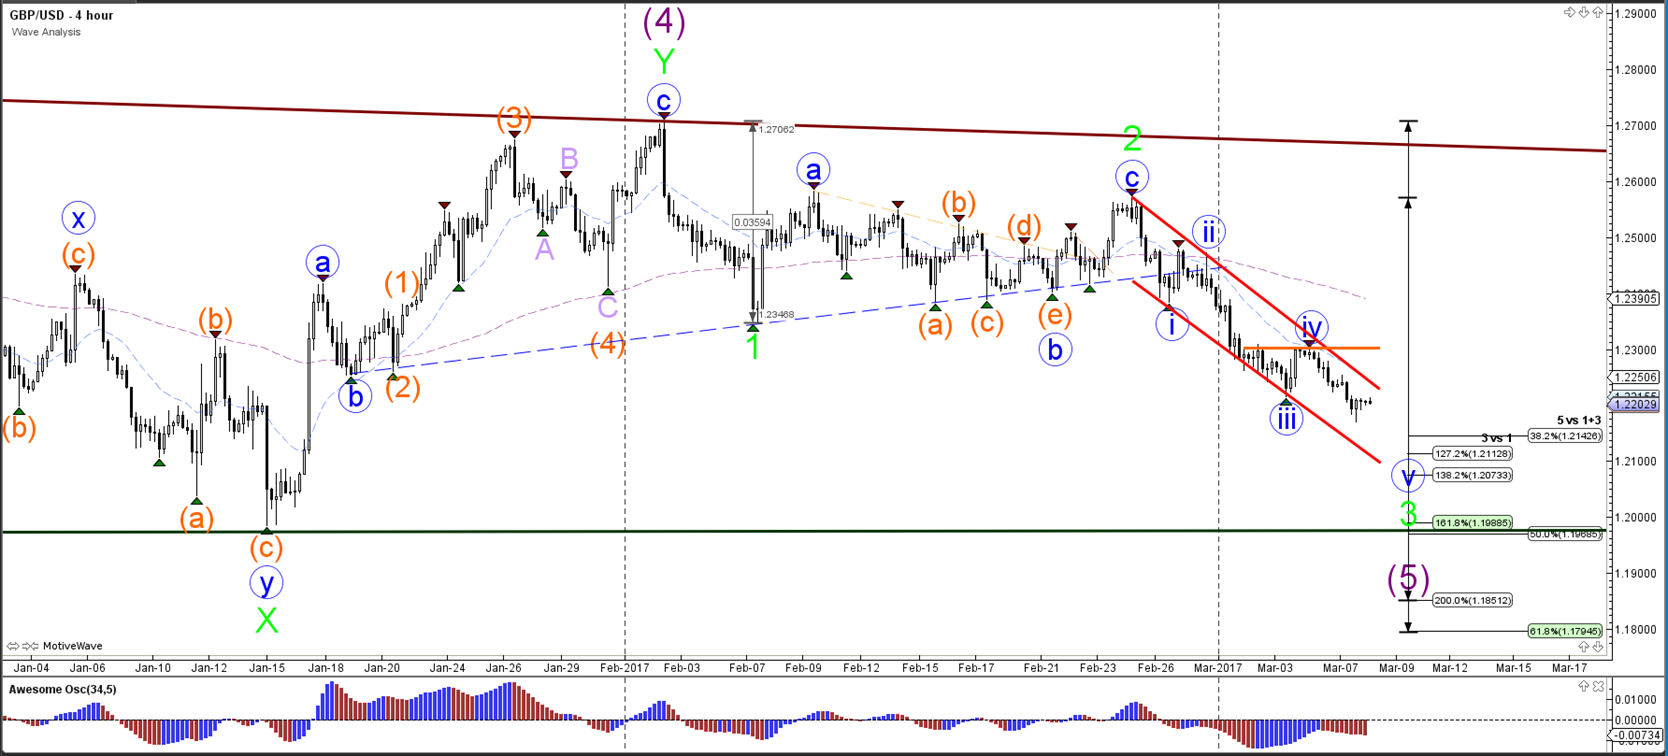
The GBP/USD continued with the downtrend yesterday and posted a new lower low. Price remains in a bearish trend as long as it stays in the channel and below resistance (red/orange).
1 hour

The GBP/USD break below the support trend line (blue) could see price continue with wave 5 (blue) of wave 3 (green). A break above the inner resistance line (light orange) could see price expand the wave 4 (orange). A break above the 61.8% Fibonacci level would make a wave 4 (orange) unlikely.



Leave A Comment