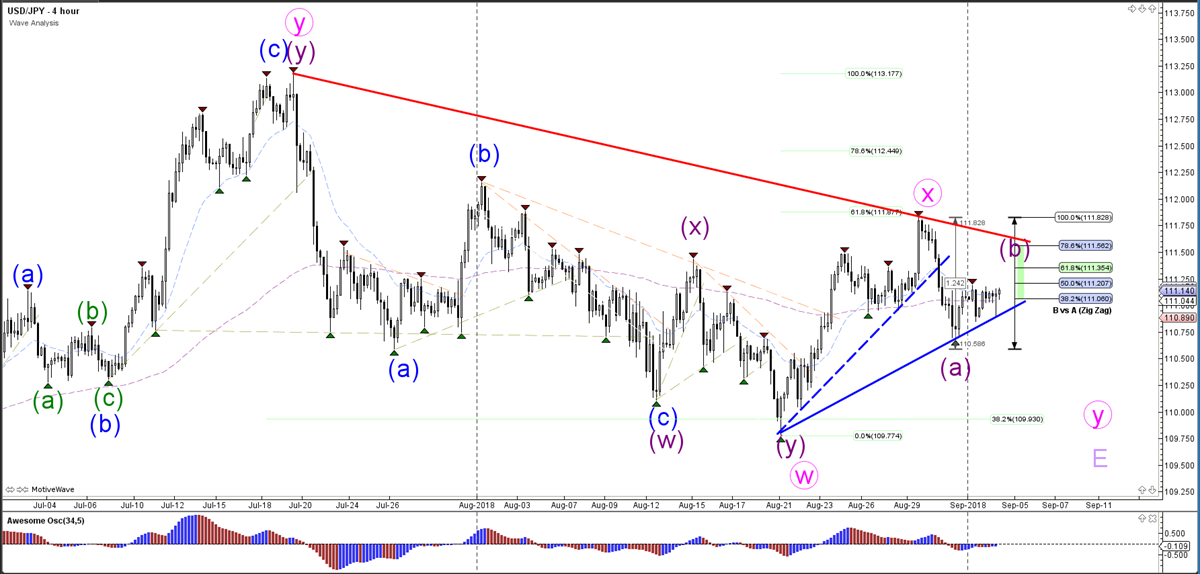
USD/JPY
4 hour

Source: Admiral Markets MT5 with MT5 USD/JPY motive wave – 4 September 2018 at 6:30
The USD/JPY has indeed made a pullback to the Fibonacci retracement levels of wave B vs A (purple). A bearish breakout below the support trend line (blue) could confirm the continuation of wave Y (pink) of wave E (purple), whereas a bullish breakout would invalidate this pattern, and would indicate a potentially larger wave X (pink) correction.
1 hour

Source: Admiral Markets MT5 with MT5 USD/JPY motive wave – 4 September 2018 at 6:30
The USD/JPY seems to be building a bullish ABC (blue) zigzag corrective pattern within wave B (purple). If the ABC is correct, then the price is expected to bounce at the Fibonacci levels of wave B (purple), and then break below the support trend line for a bearish breakout.


Leave A Comment