EUR/USD
4 hour

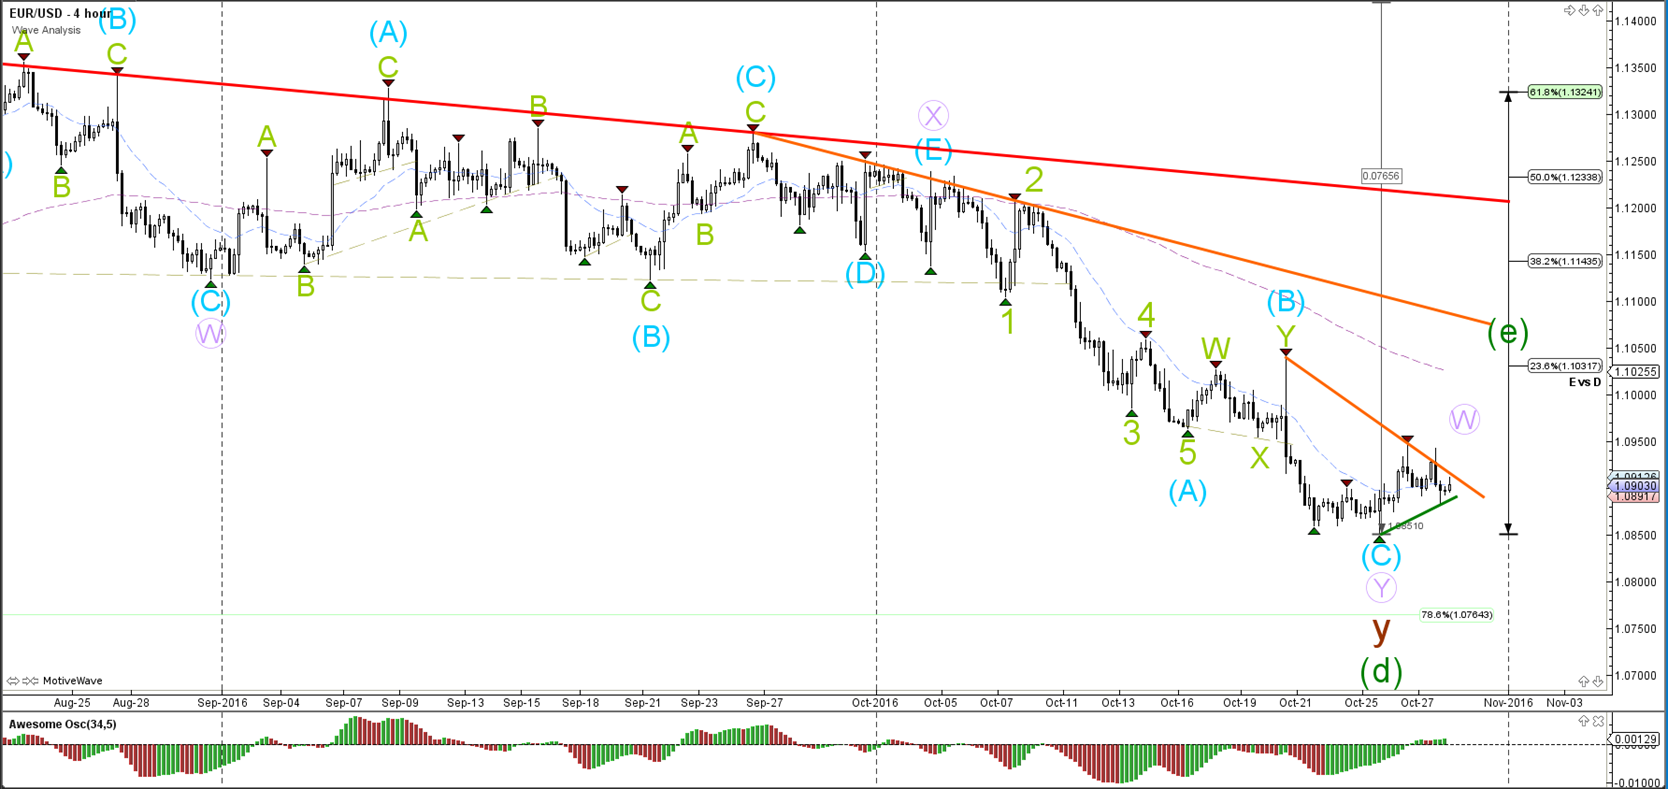
The EUR/USD is in a small triangle (green/orange lines) after having made a bullish bounce within a larger downtrend. A breakout above the resistance trend line (orange) could start a larger correction within wave e (green), which is a larger triangle on the daily and weekly charts. A breakout below support (green) could price fall towards the next Fibonacci support.
1 hour

The EUR/USD completed a bearish ABC zigzag (green). A breakout above resistance (orange) could price move towards Fib targets as part of a wave C (blue) whereas a bearish breakout below support (green) could see price fall towards the next 78.6% Fib. A break below the bottom and 100% Fib is needed before the downtrend is active.
GBP/USD
4 hour

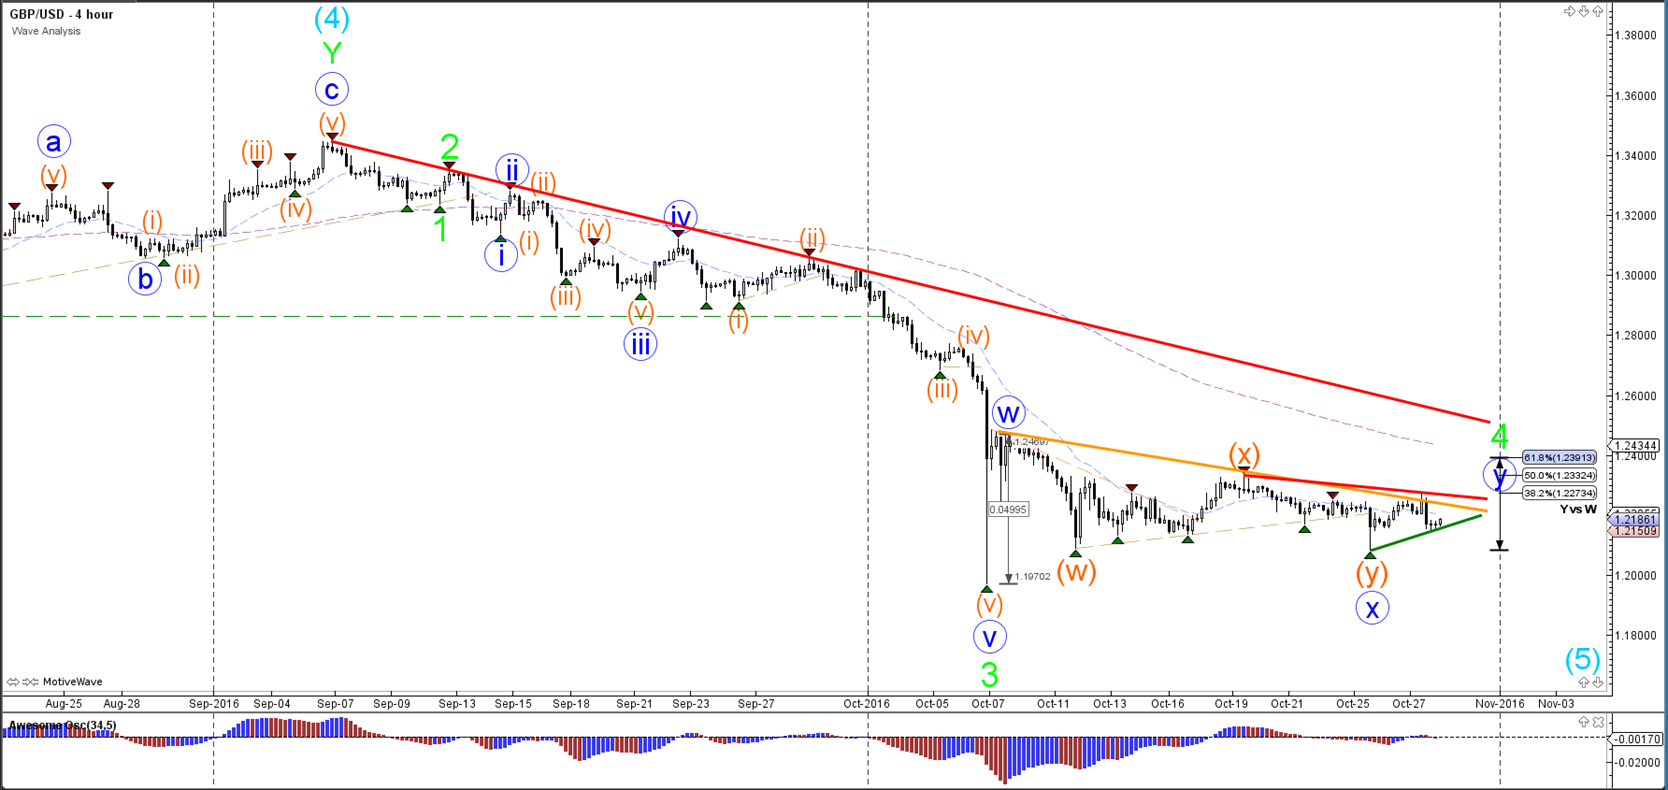
The GBP/USD is building a new triangle (red/green lines), which seems to be part of a larger WXY (blue) correction. Once wave 4 (green) is completed a downtrend continuation is expected to push below support (wave 5 blue).
1 hour

The GBP/USD completed a bearish ABC zigzag (grey) yesterday as expected. A new bearish zigzag (grey) could take price back to the resistance zone (red/orange). A break below support (green) still has to deal with the Fibonacci support levels but a break below the bottom could see price challenge the 1.20 round level.
USD/JPY
4 hour

The USD/JPY broke multiple resistance levels (dotted lines), including a daily top. The chart is now confirming a higher high and is continuing with its uptrend.
1 hour

The USD/JPY could break above resistance (red) which would indicate a chance for price to continue with its uptrend momentum towards the Fibonacci targets. A bull flag pattern could develop at this point, which is expected to be part of a wave 4 (brown). In that case price is likely to go sideways or stay above the 50% (max 61.8%) Fibonacci levels of wave 4 vs 3.


Leave A Comment