
Talking Points:
– The remainder of this week brings some interesting push points for the U.S. Dollar, with today at 2PM ET bringing the release of FOMC minutes from the September rate decision. On Friday, we get CPI and Advance Retail Sales, and each of these outlays can provoke or propel the U.S. Dollar.
– The Greenback has turned lower after last Friday’s NFP report saw USD run into a heavy zone of resistance.
Today at 2 PM brings the release of FOMC minutes from the bank’s September rate decision. The September rate decision was an interesting outlay from the Fed: This is when the bank announced that they would soon begin balance sheet reduction; but the part that probably caught most off-guard was just how hawkish they were pertaining to rate hikes to the end of this year and next. The Fed laid the groundwork for another rate move in December, and the dot plot matrix indicated that the median expectation at the bank is for another three rate hikes next year in 2018; followed by two in 2019 and one in 2020.
While the expectation of four hikes going out to the end of next year wasn’t necessarily anything new, as this was previously forecasted by the Fed; the fact that the bank continues to remain hawkish even in light of a slowdown in US data, particularly around inflation, likely caught many by surprise. This brought in a quick move of USD strength asDXY tested a key area of near-term resistance that had been set earlier in September. There was still some skepticism, however, as the Dollar turned-lower off of that resistance level around 92.67.
U.S. Dollar via ‘DXY’ Hourly: FOMC-Fueled USD (Blue) into Resistance, Higher-Low (in Green)
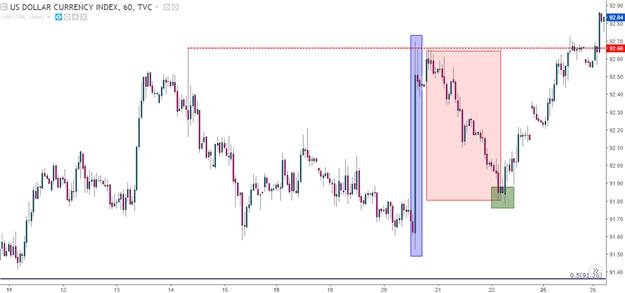
Chart prepared by James Stanley
Not more than one week later, Fed Chair Janet Yellen was giving a speech in which she mentioned that inflation below the Fed’s 2% goal would not necessarily be a hindrance to additional rate hikes. This gave another boost to the Greenback, and DXY moved up to test another level of resistance around 93.63. That move is indicated in Green on the below chart, and after setting another higher-low shortly after that resistance test, bulls took over to drive prices-higher. Eventually, price action trickled towards the longer-term zone of resistance in DXY that runs from 94.08-94.30.


Leave A Comment