VIX, the “fear gauge,” measures S&P 500 near-term volatility by using options that expire in 23–37 days. Therefore, the VIX we often discuss is the 1-month volatility index. However, the Chicago Board Options Exchange (CBOE) also publishes 3-month (VIX3M) and 6-month (VIX6M) volatility indexes, which are less well known.
The 3-month and 6-month VIX indexes are usually higher than the 1-month VIX. Similarly, those VIX futures with various expirations tracking short- and long-term VIX movements also remain in contango most of the time. The reason is that the uncertainty inherent in the long term requires a risk premium compared to the short term, comparable to the term premium in fixed-income. Another feature of the different volatility indexes is that the 1-month VIX is more volatile than the 3-month and 6-month indexes.
What if these three volatility indexes break the so-called contango position and become inverted? It doesn’t happen often, and the first time it occurred in 2018 was on Monday, February 5th. Subsequently, the market dropped to 2532.69 on the following Friday, February 9th. To put that move in perspective, the S&P 500 had just hit an all-time high of 2872.87 two weeks before the correction. So is VIX inversion a bearish signal?
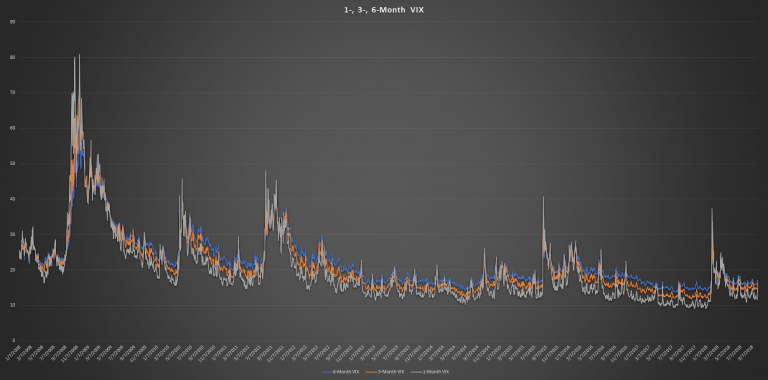
Let’s begin with some VIX inversion history (Chart 1). We adopt a strict definition of VIX inversion as follows: 1-month VIX > 3-month VIX > 6-month VIX. We count the turning point of an inversion only, excluding a run of continuous inversions. The VIX indexes are examined from 2008 forward. Since then, 2012, 2013, and 2017 are the only years without any VIX inversion. Noticeably, the average return of the S&P 500 was 23.41% for those 3 years, in contrast to 5.40% for the other years. Among the years with VIX inversions, there are about four inversions on average in each year.

Chart 1. Volatility Indexes Since 2008. Source: CBOE
At first look, VIX inversion might appear to be a non-bullish sign, but we have found a bullish silver lining in the pattern. The inversion per se suggests that the market perceives the 3-month and 6-month trends to be positive. As the result in Table 1 confirms, the 3-month and 6-month returns following the turn to a VIX inversion are higher than the contango cases. Particularly, the 6-month spread is almost 183 bps. Moreover, last time the VIX inverted in October was in 2014, which had a 6.99% 3-month return and 11.74% 6-month return.


Leave A Comment