Yesterday, as I was researching the data on the Fed’s balance sheet as it relates to the future direction of interest rates, I stumbled across an interesting piece of analysis.
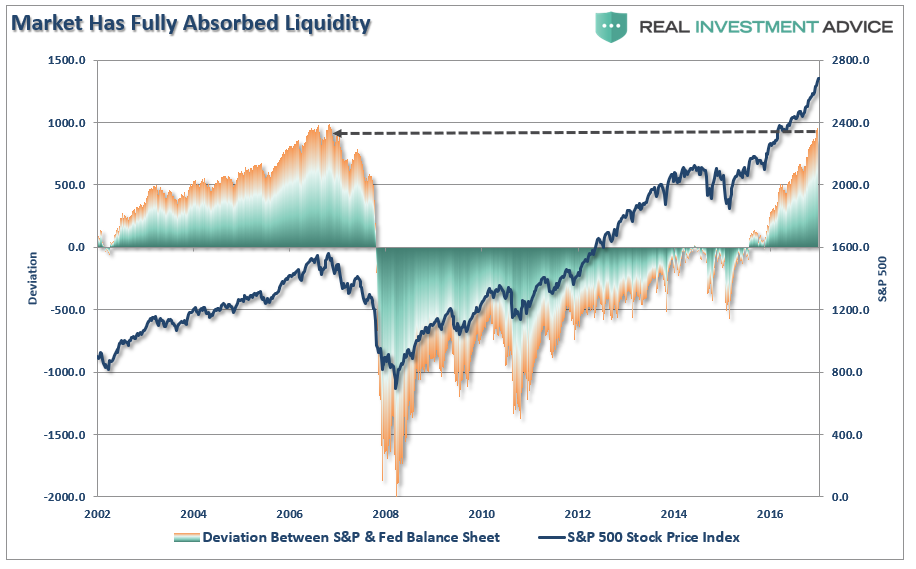
The chart below shows the deviation of the market from the underlying liquidity provided by the Fed’s balance sheet.

Not surprisingly, in 2006-2007 as the deviation reached extremes, market liquidity became problematic. While we only recognized this in hindsight, the correlation is important to consider.
Currently, this “Brawny Market” has become the “quicker picker-upper” of market liquidity. The issue becomes, as discussed yesterday, with the Federal Reserve beginning to extract liquidity from the markets, along with the ECB tapering their QE program simultaneously, at what point does liquidity once again become a problem?
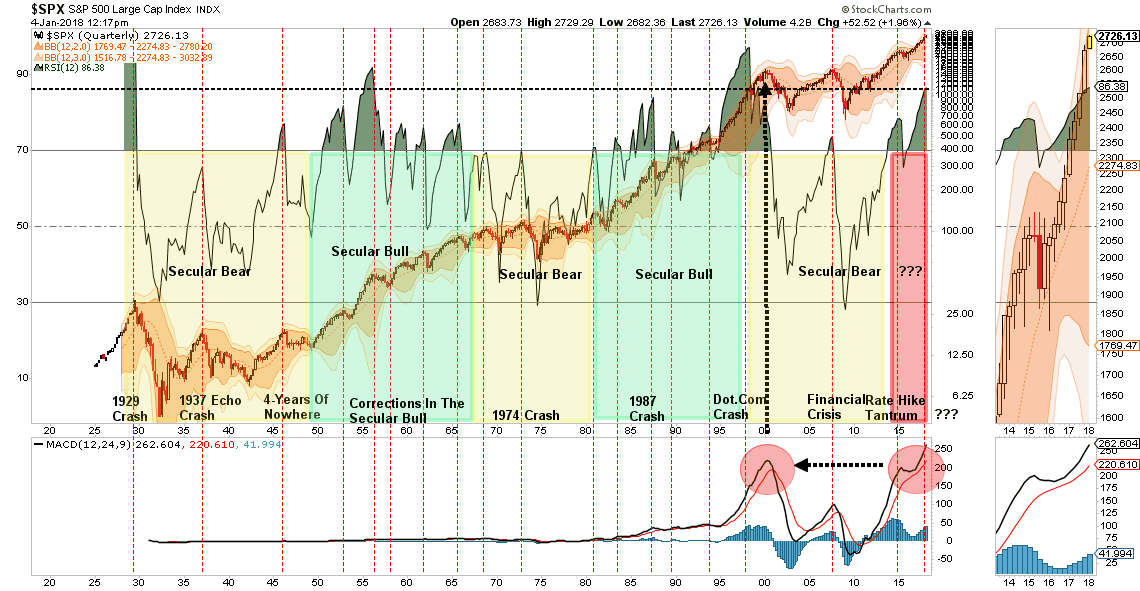
For now, however, market exuberance has completely overtaken investor mentalities. Such is not surprising as we head into the 9th-year of the current bull market advance. As shown in the chart below, the current market conditions, while bullish and positive which keeps portfolios allocated toward risk, are at levels seen only three-times previously.

Such does not mean a “crash” is coming tomorrow, but it does suggest that this “Brawny Market” has much more limited upside than what most investors currently believe.
Remain long equities for now. But don’t forget that what goes up, will eventually come down. So it is worth paying attention to the risk and having a plan of action in place to do with the eventual reversion when it comes.
Just something to think about as you catch up on your weekend reading list.
Economy & Fed


Leave A Comment