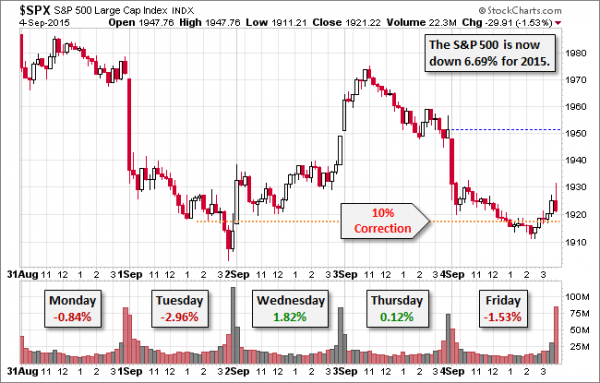
Sometimes the calendar dictates the agenda. The Labor Day weekend marks the official end of a summer that was eventful for markets. The punditry will be asking:
What is your (revised) EOY target for stocks?
Prior Theme Recap
In my last WTWA I predicted that everyone would be focused on the lessons from the prior market turmoil. That was mostly wrong, since there was too much new turmoil! As he does each week, Doug Short’s recap explains this dramatic story and his great weekly snapshot lets you see it at a glance. With the ever-increasing effects from foreign markets, you should also add Doug’s Doug Short’s recap to your reading list.
The chart shows the changing “lesson” that we might draw, starting with sharp selling on Tuesday (CNBC Markets in Turmoil back on the air), a comforting rally on Thursday morning, and the decline through the end of the week. It was an ever-changing lesson.

Doug provides several great charts, including all of the drawdowns from the most recent peak since 2009. The current weakness is the third largest.
We would all like to know the direction of the market in advance. Good luck with that. Second best is planning what to look for and how to react. That is the purpose of considering possible themes for the week ahead. You can try it at home.
Last week some advance planning was especially important. There was little time to react intelligently.
This Week’s Theme
The market correction is causing some firms to revise their year-end targets for stocks. Because the decline occurred while many were on vacation, reconsidering targets will be job one for those getting back to the office.
The question is whether the key fundamentals remain intact, or whether something has changed? Whether the bull market trends continue, or recent selling changes the trend. Simply put,
What is your year-end target for stocks?
The question encompasses an array of issues.
The Viewpoints
Last week’s presentation, which showed alternative positions as separate bullet points, seemed to confuse some readers. I was trying to illustrate opposing takes, while (as always) confining my own opinion to the conclusion. Let me try again with a different approach.
To provide a clear contrast, I am over-simplifying the bull and bear cases. Your target for the market depends heavily on the topics listed in the table below (which include some links).
While the correspondence is not perfect, the optimists include many of the chief global strategists from major firms, professional economists, and investment managers who take a value perspective. The pessimists include most of the trading community, bond managers, “independent” economic thinkers, and conspiracy buffs. If you are inclined to disagree, I invite you to make your own list and share results in the comments. You might start by reading this week’s cover story in Barron’s, U.S. Stocks Could Rally More Than 10% by Year End.
This contrasts sharply with nearly any site with a short-term, trading focus. The difference is simply a statement of fact. The question is, “Why?”
Scott Grannis suggests (including an interesting series of charts) that the only change has been in volatility.
What’s the source of the volatility? It could be the disconnect between investors’ fears of the future and the lack of evidence that the fundamentals of the U.S. economy are deteriorating. Fears can’t get traction if they don’t impact the economy in some fashion, but they can make for choppy markets.
As always, I have my own ideas in today’s conclusion. But first, let us do our regular update of the last week’s news and data. Readers, especially those new to this series, will benefit from reading the background information.
Last Week’s Data
Each week I break down events into good and bad. Often there is “ugly” and on rare occasion something really good. My working definition of “good” has two components:


Leave A Comment