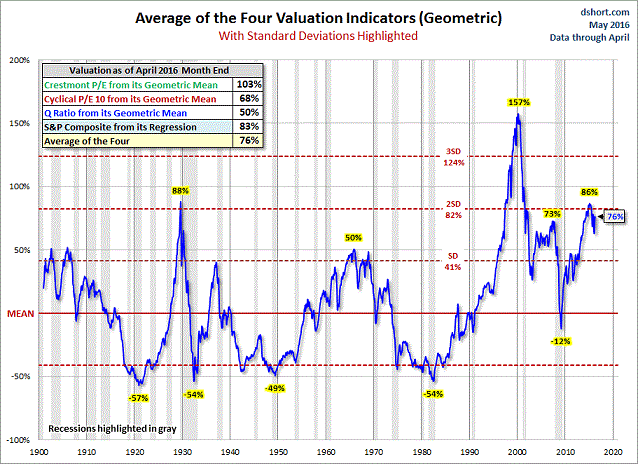
Some analysts may dismiss 115 years of economic data. I do not. In particular, if one averages the results of four respected stock valuation methodologies, one finds that stocks are wildly expensive. Greater irrationality in stock price exuberance only existed during conditions prior to the Great Depression circa 1929 and the tech wreck of 2000.
Consider the chart below. Based on the analysis by Doug Short, the widely cited Vice President of Research at Advisor Perspectives, the U.S. stock market is overvalued by 76%. It is worth noting that on all three occasions when the aggregate average approached two standard deviations above a geometric mean – 1929, 1999, 2007 – U.S. stocks collapsed by 50% or more. In addition, current valuation extremes surpass those reached in 2007.

Investors should be mindful of the fact that Mr. Short does not typically offer “bearish” or “bullish” commentary. He usually provides investment and economic research, allowing others to draw their own conclusions. That said, he has served up bullet points on the high probability that market returns will be low over the next 7-10 years. Mr. Short has also mentioned that tactical asset allocation will be more important in the coming decade, as holding the S&P 500 for the next 7-10 years is likely to be “disappointing.”
Keep in mind, elevated valuations in and of themselves may not provide much insight with respect to reducing risk in one’s portfolio. Years of valuation extremes can persist when other factors are at play. (Think central bank interest rate and balance sheet shenanigans.) Nevertheless, an economy that shows signs of stagnation coupled with signs of “risk-off” positioning can break the back of a stock market bull, particularly when interest rate manipulating, balance sheet expanding central banks are only running on fumes.


Leave A Comment