May you live in uninteresting times.
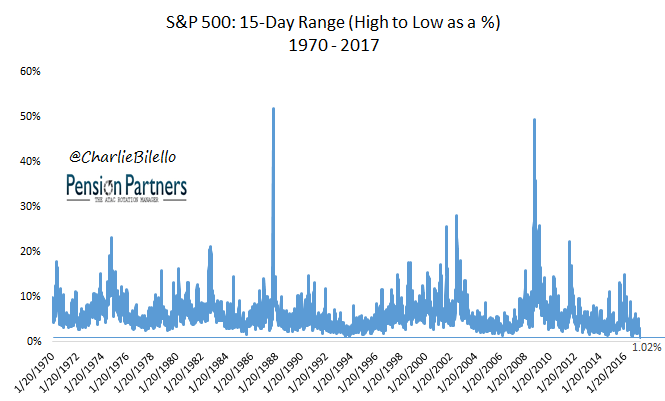
Market volatility has become a thing of the past. To wit, the S&P 500 (over the past 15 trading days) is trading in its narrowest range in history.

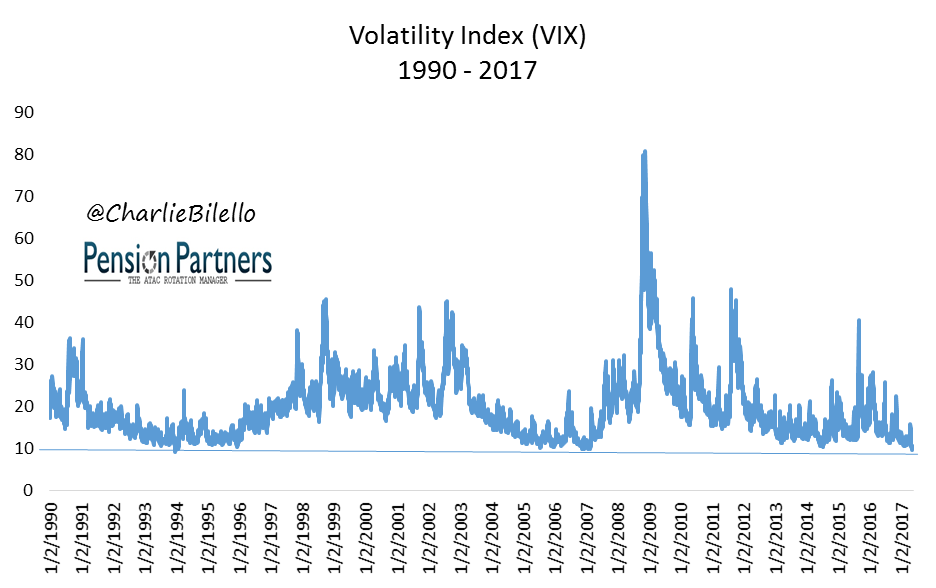
The VIX, the so-called “Fear Index,” is lower than 99% of historical readings.

What are investors afraid of these days? You guessed it: the lack of fear. When volatility inevitably rises, investors are worried that will mean the end of the road for stocks.
This is not the first time they’ve had this concern. We have dispelled the myth that low volatility means stocks have to go down (it does not) a number times in the past few years. But the myth lives on.

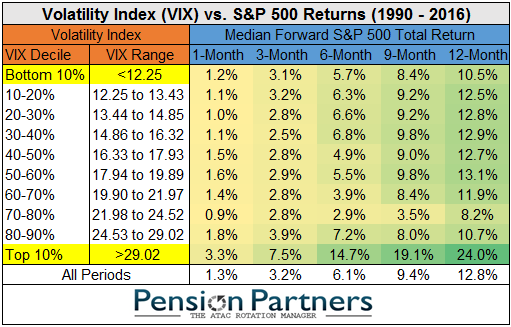
So let’s try a different approach and talk about probabilities. If volatility rises from here (as is likely), what are the odds that the S&P 500 will post a positive return?
The answer: it depends. On what? Time frame.
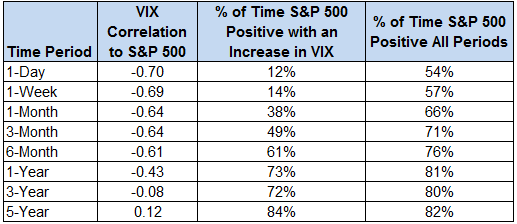
If volatility rises tomorrow, the S&P 500 has a 12% chance of being up (based on historical data going back to January 1990). But if volatility rises over the next 3 years, the S&P has a 72% chance of rising.

Why the huge difference?
Time frame. As the time period lengthens, the relationship between stocks and changes in volatility weakens. The correlation between the percentage change in the VIX and percentage change in the S&P 500 goes from highly negative at 1 day (-0.70) to only slightly negative at 3 years (-0.08).
Why is this the case?
Because of path.
Saying that volatility is higher today than 3 years ago tells you nothing about the path. The path could very well have been up, up, up until the very end of the 3 year period when volatility finally spiked and stocks gave back some of their gains. Or the path could have been down, down, down with a surge upward near the end to bring stocks higher on a 3-year basis with higher volatility.


Leave A Comment