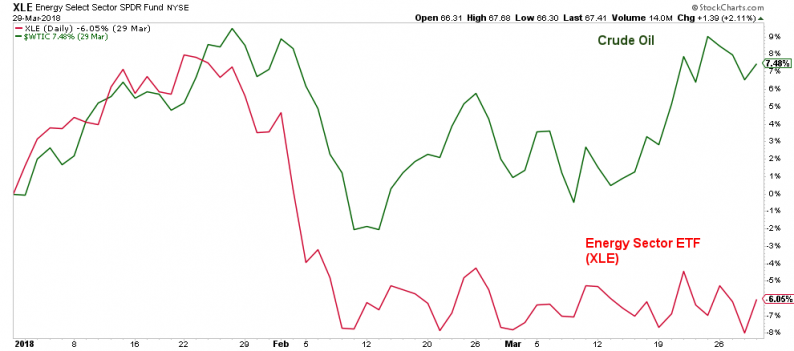
At the end of the first quarter, Crude Oil was up 7.5% while Energy stocks were down 6.1%. How unusual is such a divergence? Let’s take a look.
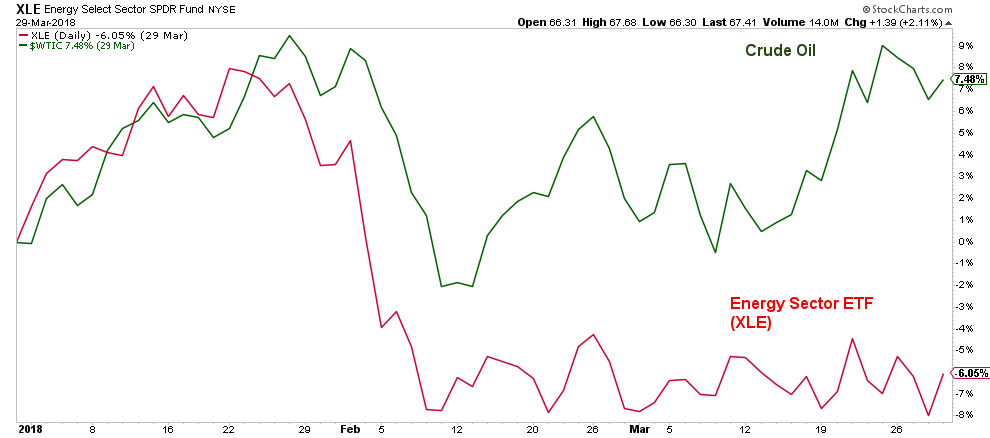
Note: References to Energy/Energy Stocks/Energy Sector throughout this post are referring to the S&P 500 Energy Sector ETF (XLE), total return data from Stockcharts.com.
Since the inception of the Energy sector ETF (XLE) in December 1998, Crude Oil and Energy stocks have moved in the same direction on a rolling 3-month basis roughly 74% of the time. On a rolling one-year basis this moves up to 76%.
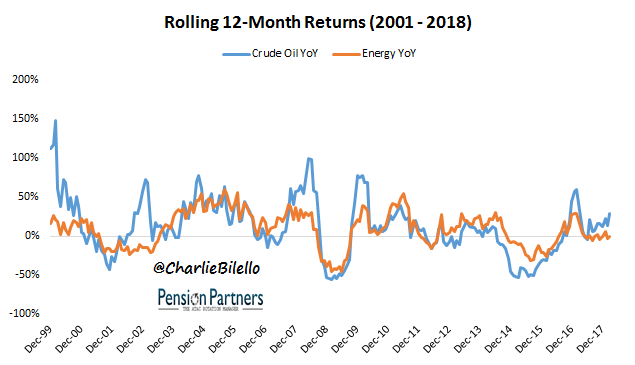
Why don’t they move together 100% of the time?
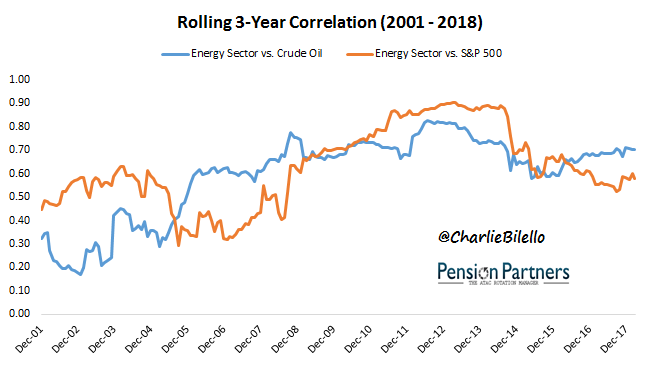
At the end of the day, Energy stocks are still stocks, and they have actually exhibited a slightly higher correlation with the S&P 500 (0.62) than with Crude Oil (0.57). Energy and Crude often move in the same direction, but often is far from always.
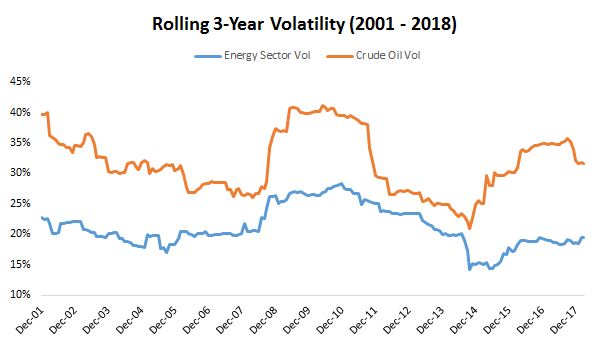
Another important factor is volatility. At 32.6% annualized, Oil is much more volatile than Energy stocks at 21.4%.

Note: Crude Oil stats are continuous futures data via stockcharts.com. SPY and XLE stats are total return.
On a rolling 3-year basis, Oil volatility has always exceeded the volatility in Energy.
The moves in Crude Oil often dwarf those in the Energy sector, as evidenced by down capture and up capture statistics. The energy sector has had 43% of the downside of Crude Oil on average and 30% of the upside. As compared to the S&P 500, the Energy stats are much closer, with 93% of the downside and 98% of the upside.

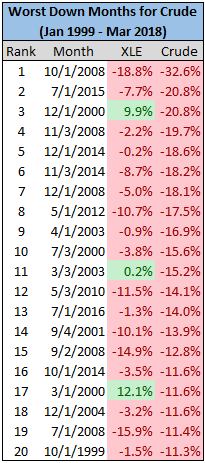
Another way to illustrate the large difference in volatility is to look at the 20 worst monthly declines for Crude Oil. During these months Crude Oil averaged a return of -16.3% versus a return of -4.9% for Energy.
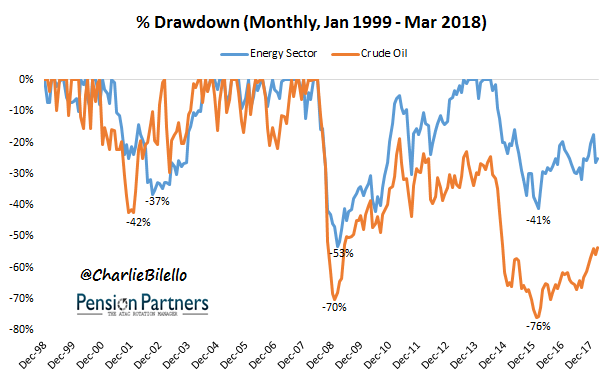
The worst drawdown in Crude (-76%) has far exceeded the worst drawdown in Energy (-53%).
How does the performance of Energy stocks compare to the underlying commodity?
Energy tends to outperform the commodity during down periods for Crude Oil.



Leave A Comment