Three months ago to the day (6/30), I served up a list of reasons for lowering one’s exposure to riskier assets. I discussed weakness in market internals where fewer and fewer corporate components of the Dow and S&P 500 had been propping up the popular U.S. benchmarks. I talked about the faster rate of deterioration in foreign stocks over domestic stocks via the Vanguard FTSE All-World (VEU):S&P 500 SPDR Trust (SPY) price ratio. Additionally, I highlighted exorbitant U.S. stock valuations, the Federal Reserve’s rate hike quagmire and the ominous risk aversion in credit spreads.
Three months later (9/30), a wide variety of risk assets are trading near 52-week lows or near year-to-date lows. Higher yielding bonds via PIMCO 0-5 Year High Yield Corporate (HYS) as well as iShares iBoxx High Yield Bond (HYG) are floundering in the basement. Energy via Equal Weight Energy (RYE) has broken down below the S&P 500’s correction lows of August 24, suggesting that a bounce in oil and gas may be premature. Even former leadership in the beloved biotech sector via SPDR S&P Biotech Index (XBI) reminds us that bearish drops of 33% can destroy wealth as quickly as it is accumulated.

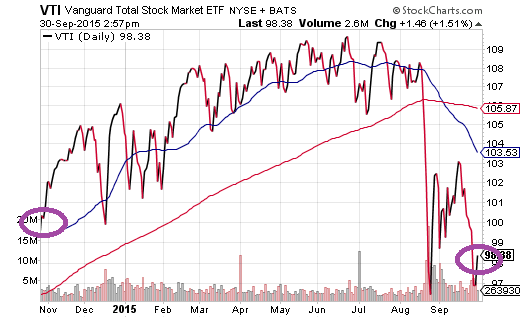
Is it true that, historically speaking, bull market rallies typically fend off 10%-19% pullbacks? Absolutely. Yet there is nothing typical about zero percent rate policy for roughly seven years. For that matter, there was nothing normal about the U.S. Federal Reserve’s quantitative easing experiment – an emergency endeavor where $3.75 trillion in electronic dollar credits were used to acquire government debt and mortgage-backed debt. And ever since its 3rd iteration came to an end eleven months ago, broad market index investments like Vanguard Total Stock Market (VTI) have lost ground.

The same thing happened in 2010 during “QE1.” Once it ended, risk assets had lost their mojo. Then in September of 2010, rumors swirled about the Fed engaging in a second round of quantitative easing (a.k.a. “QE2?). And then the bull rally was back in business.


Leave A Comment