Courtesy of: Visual Capitalist
House Republican leaders were slated to propose a bill this week linking a debt ceiling increase to conservative issues. Under the new proposal, the debt ceiling would be increased from $18.1 trillion to $19.6 trillion, and would likely extend through 2018.
However, new reports out of Washington suggest that internal support for the bill from Republican lawmakers is divided, and it is unlikely to go to the floor. Where things go from here are unclear. If it gets down to the wire, Republicans willing to play ball may have to seek Democrat support, but this would likely void any concessions to spending as originally proposed.
Congress is likely on the brink of another deadlock, similar to 2011 or 2013, in which debate will rage on even past the Treasury’s deadline of November 3. The end result is obvious: the limit will be increased. However, in the meantime, there is likely to be no shortage of brinkmanship as both parties do their song and dance.
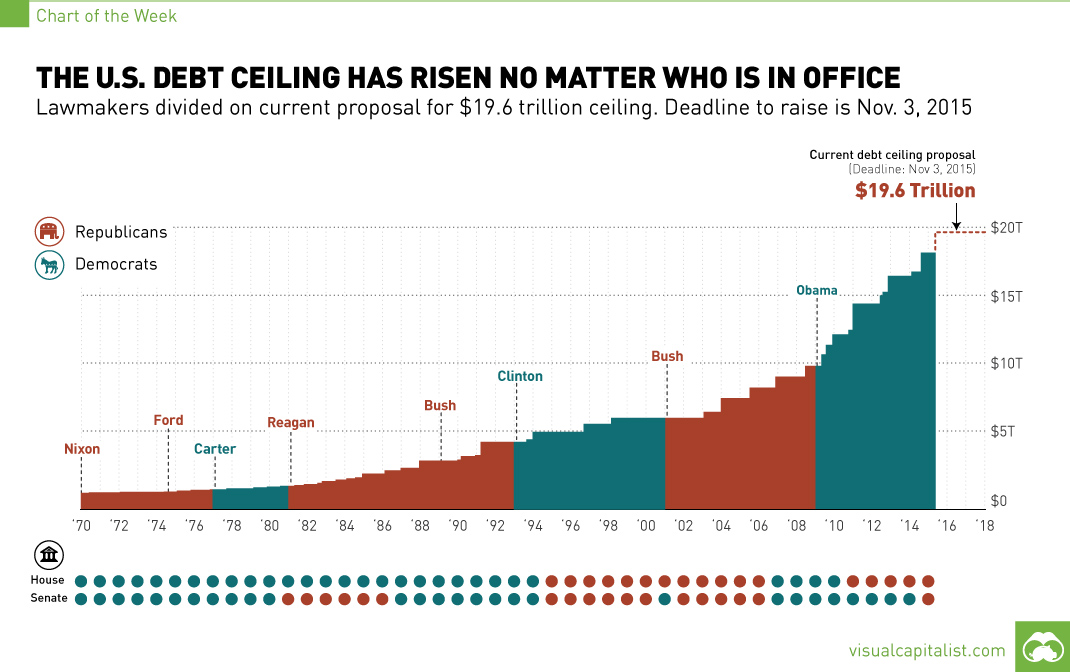
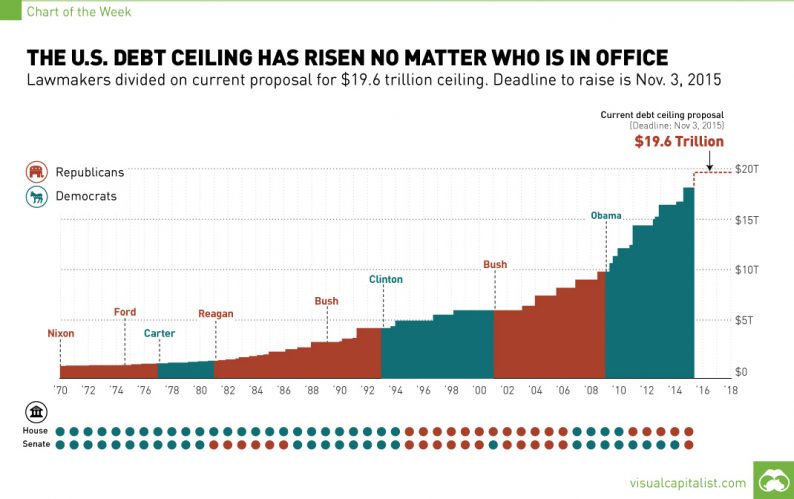
This week’s chart shows the parabolic increase to the statutory debt limit from 1970 until today. The chart also includes the potential $19.6 trillion ceiling as described in the most recent proposal, as well as the lawmakers in control during each time period.
What is clear from this data is that over the past, the debt limit will increase no matter who is in control. While there may be minor differences, the ceiling as well as federal debt have reached unprecedented levels as a result of both parties. That is why the United States now has 29% of total sovereign debt and also the 2nd highest national debt when measured in terms of debt-to-revenue.
If a compromise isn’t reached, at some point the United States government would become unable to make payments on spending it has already committed to. The result would be a default on its debt obligations.


Leave A Comment