In my new paper on asset allocation I go into quite a bit of detail about why certain asset classes generate the returns they do. Understanding this is useful when thinking in a macro sense and trying to gauge why financial assets perform in certain ways in both the short-term and the long-term. It’s important to understand the fundamental drivers of these returns in order to avoid falling into the trap that these assets generate returns due to the way they’re traded in the markets.
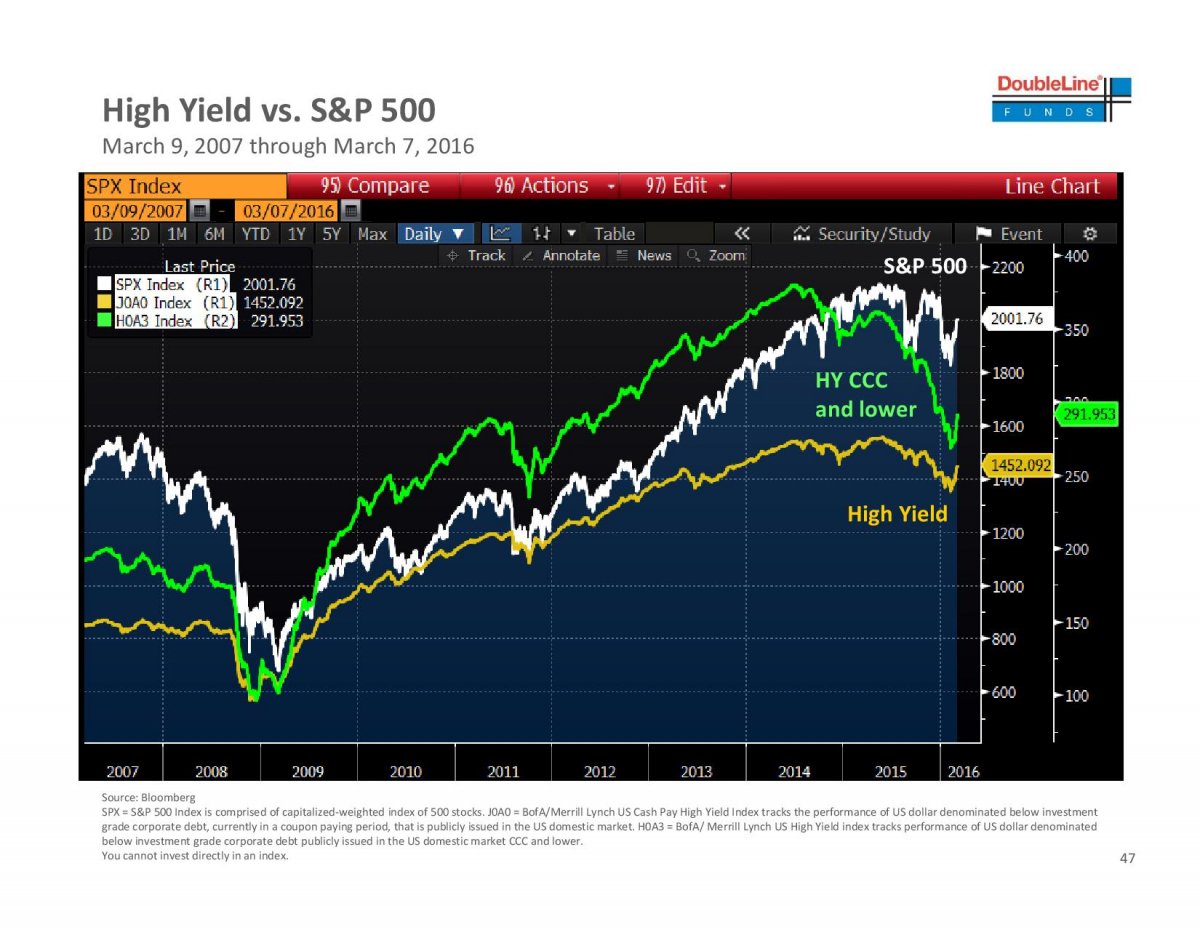
One of the more common misconceptions I see in the financial space is that credit traders are smarter than equity traders. This is usually presented with charts showing how credit “leads” equity performance or something like that. One of the more egregious offenders of this is a chart that has been going around in the last few days from Jeffrey Gundlach’s presentation showing credit relative to equity:

One might look at this and conclude that these lines should necessarily converge at some point. As if the credit markets know something that the equity markets don’t. This is usually bandied about by bond traders who are convinced that stock traders are a bunch of dopes.¹ But this is silly when you think of things in aggregates because, in the long-run, the credit markets generate whatever the return is on the instruments that have been issued and not because bond traders are smarter or dumber than other people.² For instance, XYZ Corporate Bond paying 10% per year for 10 years doesn’t generate 10% for 10 years because bond traders are smart or stupid. It generates a 10% annualized return because the issuing entity pays that amount of income over the life of the bond. In fact, the more traders trade this bond the lower their real, real return will be. Trying to be overly clever about trading the bond, in the aggregate, only reduces the average return earned by its holders as taxes and fees chew into that 10% return.


Leave A Comment