Explainer: Why Markets are Worried About the Yield Curve
If you pay any attention to financial media, chances are that you’ve heard increased chatter about the flattening “yield curve” in the past few weeks.
For professional investors, talking about the yield curve is close to second nature – but to most regular folks, the words probably sound very abstract or esoteric.
What’s a Yield Curve?
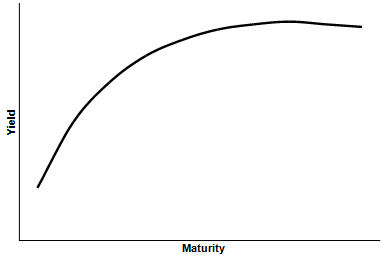
The yield curve is a curve showing several yields or interest rates across different bond contract lengths.
In a normal credit environment, the premise is that yields are higher for longer maturity bonds.

In a way, this is similar to what you’d expect if you went to the bank and put your money into a time deposit. For example, if you put your money in for five years, you’d expect a higher return per year than if you put your money in for six months.
Why? You’re taking on more risk, and therefore deserve a higher rate of compensation.
Out of Whack
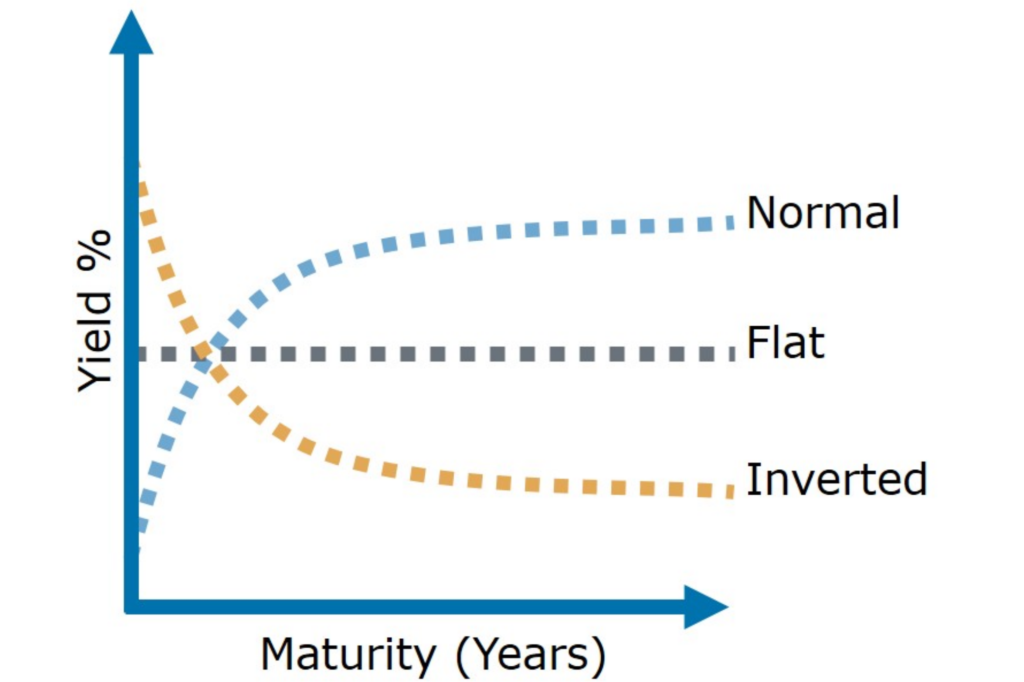
Sometimes the market gets out of whack, and yield curves do some interesting things.

As you can see above, sometimes long-term interest rates can be equal to those of short-term rates. This is called a “flat” yield curve.
Or, when long-term rates fall below short-term rates, that is an “inverted” yield curve. As you’ll see shortly, this can be a signal of trouble in credit markets and the greater economy as a whole.
The Curve Everyone is Talking about
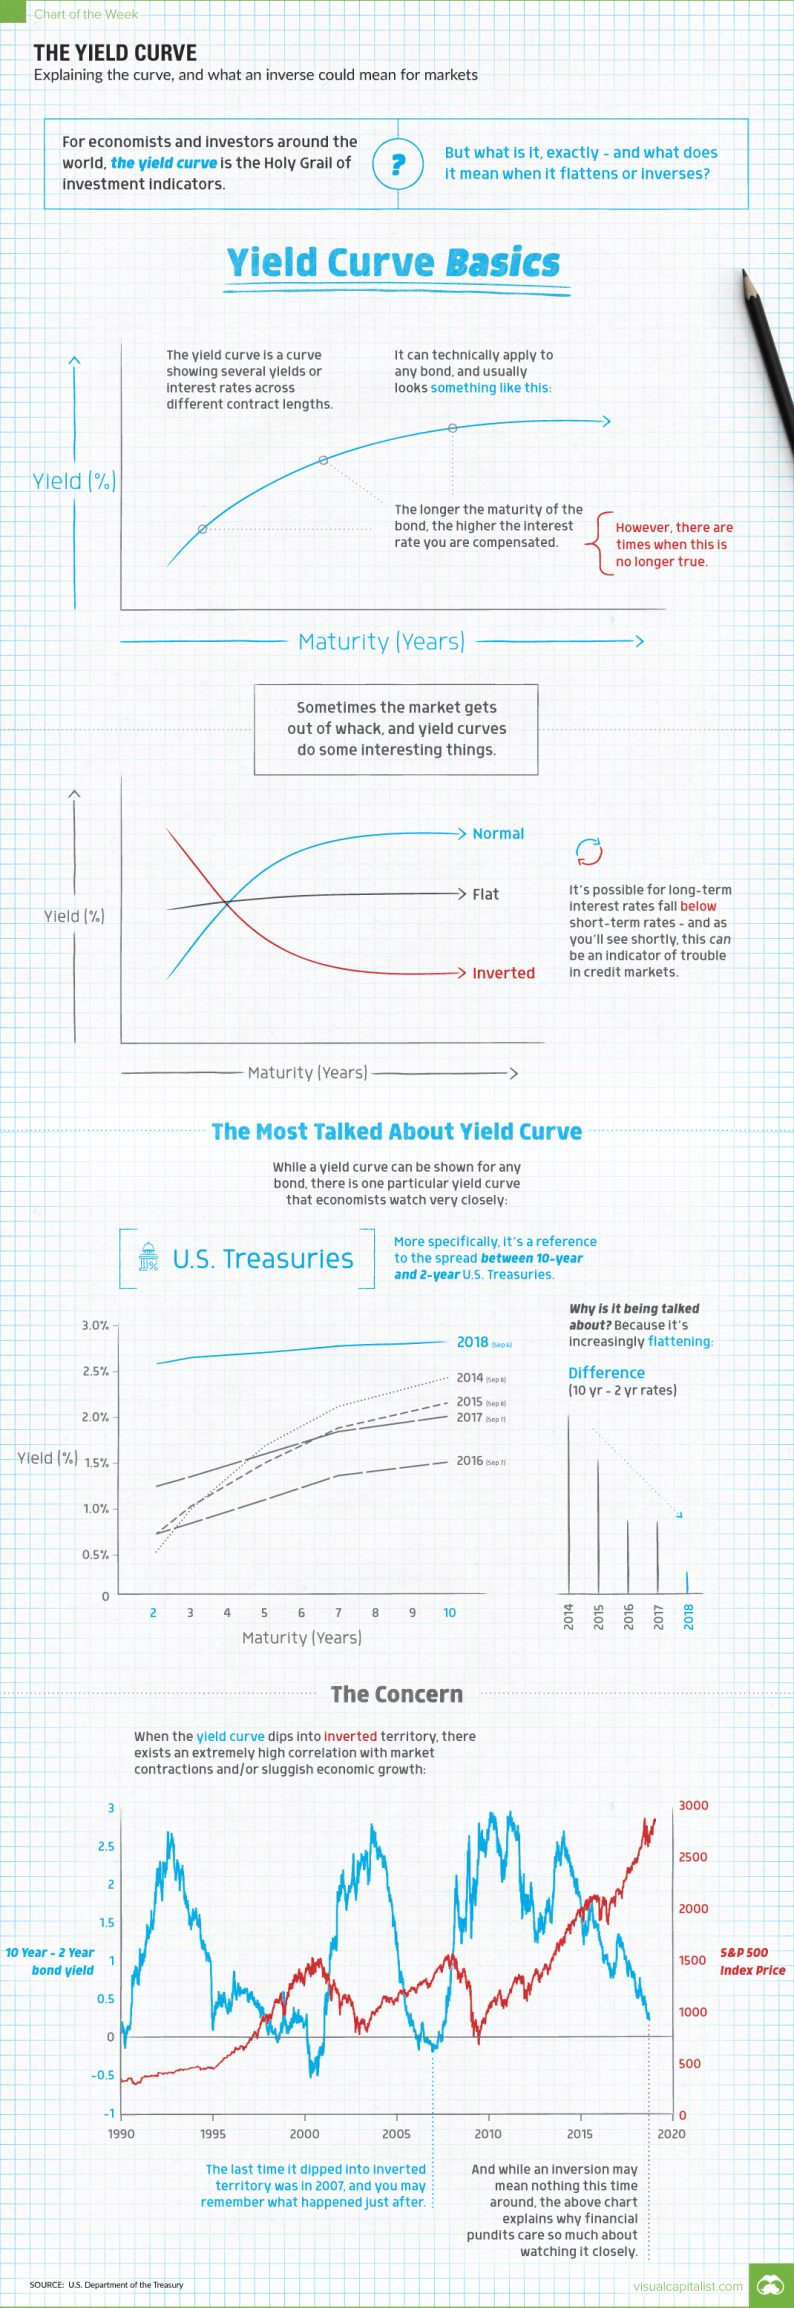
While a yield curve can be shown for any bond, there is one particular yield curve that you’ll often see referenced by financial journalists and analysts.
That would be the yield curve for U.S. Treasuries, the bonds issued by the U.S. federal government to fund its activities. More specifically, the difference between 10-year and 2-year bonds has been a historical indicator of the health of the economy and markets.
And despite this curve looking pretty normal since the financial crisis, it has been flattening over time:


Leave A Comment