One of the enduring mysteries for conventional economists is why wages aren’t rising for the bottom 95% even as unemployment is low and hiring remains robust. According to classical economics, the limited supply of available workers combined with strong demand for workers should push wages higher.
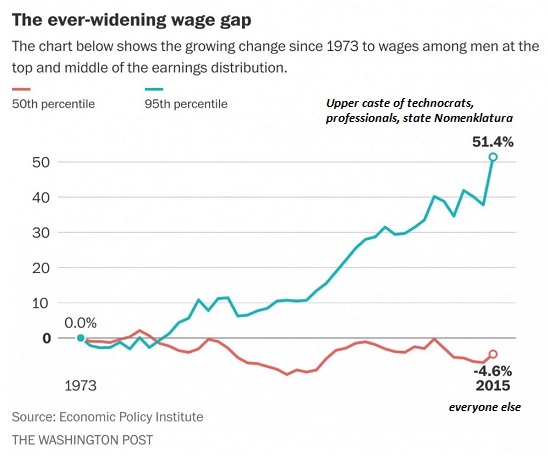
Why have wages for the bottom 95% lost ground in an expanding economy? We can start our search for answers by looking at a chart of wages going back 44 years to the early 1970s. Note that the top 5% began pulling away in the 1980s, when financialization and globalization took off, and accelerated in the 1990s tech boom and the early 2000s housing bubble. The bottom 95% benefited from these booms, but at a much more modest level: wages for the bottom 95% almost returned to 0% gain as opposed to actual declines.
But after the wheels fell off the bubble in 2008/09, the “recovery” since then has seen wages for the top 5% soar and the wages for the bottom 95% crater. (This chart is for males; the next chart reflects family income.)

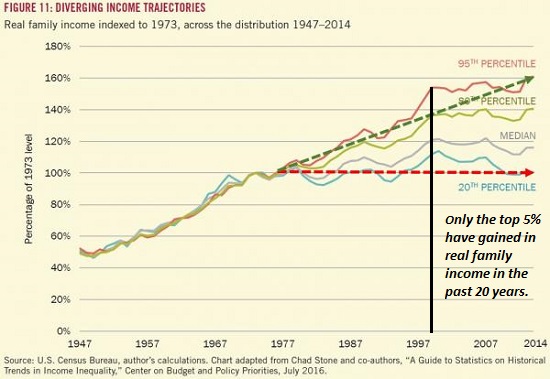
Here’s family income going back to the postwar boom of the late 1940s and 1950s. Note the structural change in the early 1970s and the stagnation in all income levels since 2000:

The forces that gathered steam in the 1970s, 80s and 90s that pressured wages are well-known: financialization, which benefited the top echelons at the expense of the increasingly burdened debt-serfs; globalization, which pitted American workers against an ever-expanding global work force of low-paid employees, and automation/software, which expanded from the factory floor into service sectors.
Those workers with the skills required by financialization, globalization and automation–the technocrat and managerial classes–benefited mightily, while those who could not add enough value at the top of the chain saw their wages stagnate.
But these structural forces don’t explain all the stagnation of wages for the bottom 95%. There are three other equally powerful structural forces at work:


Leave A Comment