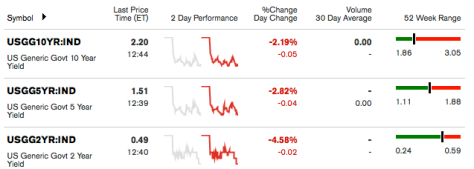
It’s in a risk ‘OFF’ alignment with all durations dropping but the curve rising.

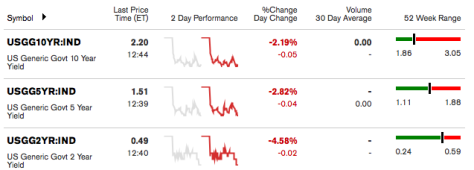
10, 5 & 2 year yields from Bloomberg
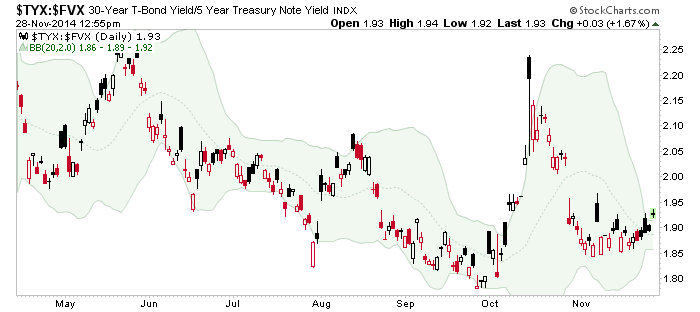
Meanwhile, here’s the chart of the 30 vs. the 5 year spread. Obviously risk is in a downtrend bigger picture, but it is a little bouncy today…
Click on picture to enlarge

While other indicators are positive for the gold sector, this one – along with the very bullish stock market – has been a hold out and gold bugs have not seemed to factor that.


Leave A Comment