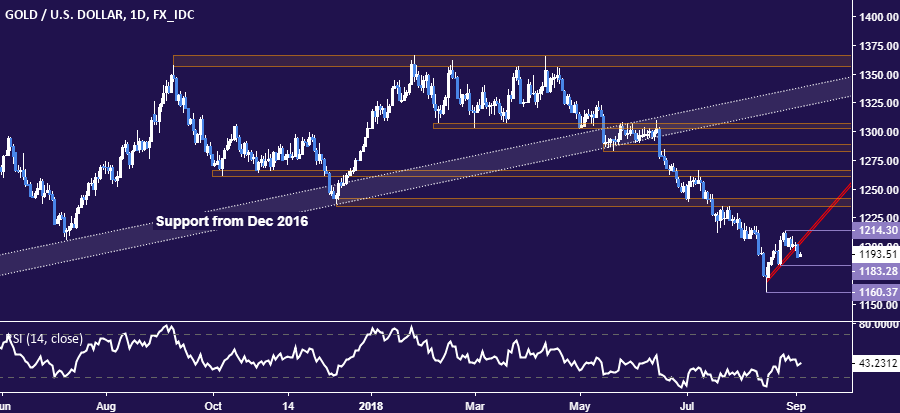
Gold prices plunged as renewed worries about the impact of a Fed-driven rise in global borrowing costs weighed on emerging market assets and stoked broader risk aversion. That fueled haven demand for the US Dollar, pressuring the perennially anti-fiat yellow metal.
The US unit and Treasury yields rose while gold suffered alongside the bellwether S&P 500 equities index as well as MSCI emerging market shares and currencies benchmarks. Crude oil prices also fell in risk-off trade, erasing earlier gains scored amid worries about damage to US capacity from Tropical Storm Gordon.
GOLD AT RISK OF DEEPER LOSSES, API INVENTORY DATA DUE
Sentiment may remain on the defensive in the hours ahead. Indeed, futures tracking the FTSE 100 stock index are pointing decidedly lower ahead of the opening bell in London. That may continue to power US Dollar gains at the expense of commodity prices.
API inventories data headlines the economic calendar. The outcome will be weighed up against expectations calling for a 2.11 million barrel outflow to be reported in official EIA figures on Thursday. A smaller draw may weigh on crude oil prices while a larger one might boost them.
GOLD TECHNICAL ANALYSIS
Gold prices look to be resuming the dominant decline launched in mid-April after breaking counter-trend support guiding the upswing from August lows. A daily close below the August 24 low at 1183.28 opens the door for a test of the swing bottom at 1160.37. Alternatively, a push back above the August 28 high at 1214.30 targets the 1235.24-41.64 area.

CRUDE OIL TECHNICAL ANALYSIS
Crude oil prices faltered on a test above resistance in the 70.15-41 area. From here, a move below the outer layer of immediate support at 68.69 exposes the longer-term uptrend boundary in the 65.15-67.00 area. Alternatively, a daily close above resistance paves the way for a retest of the inflection point at 72.88.


Leave A Comment