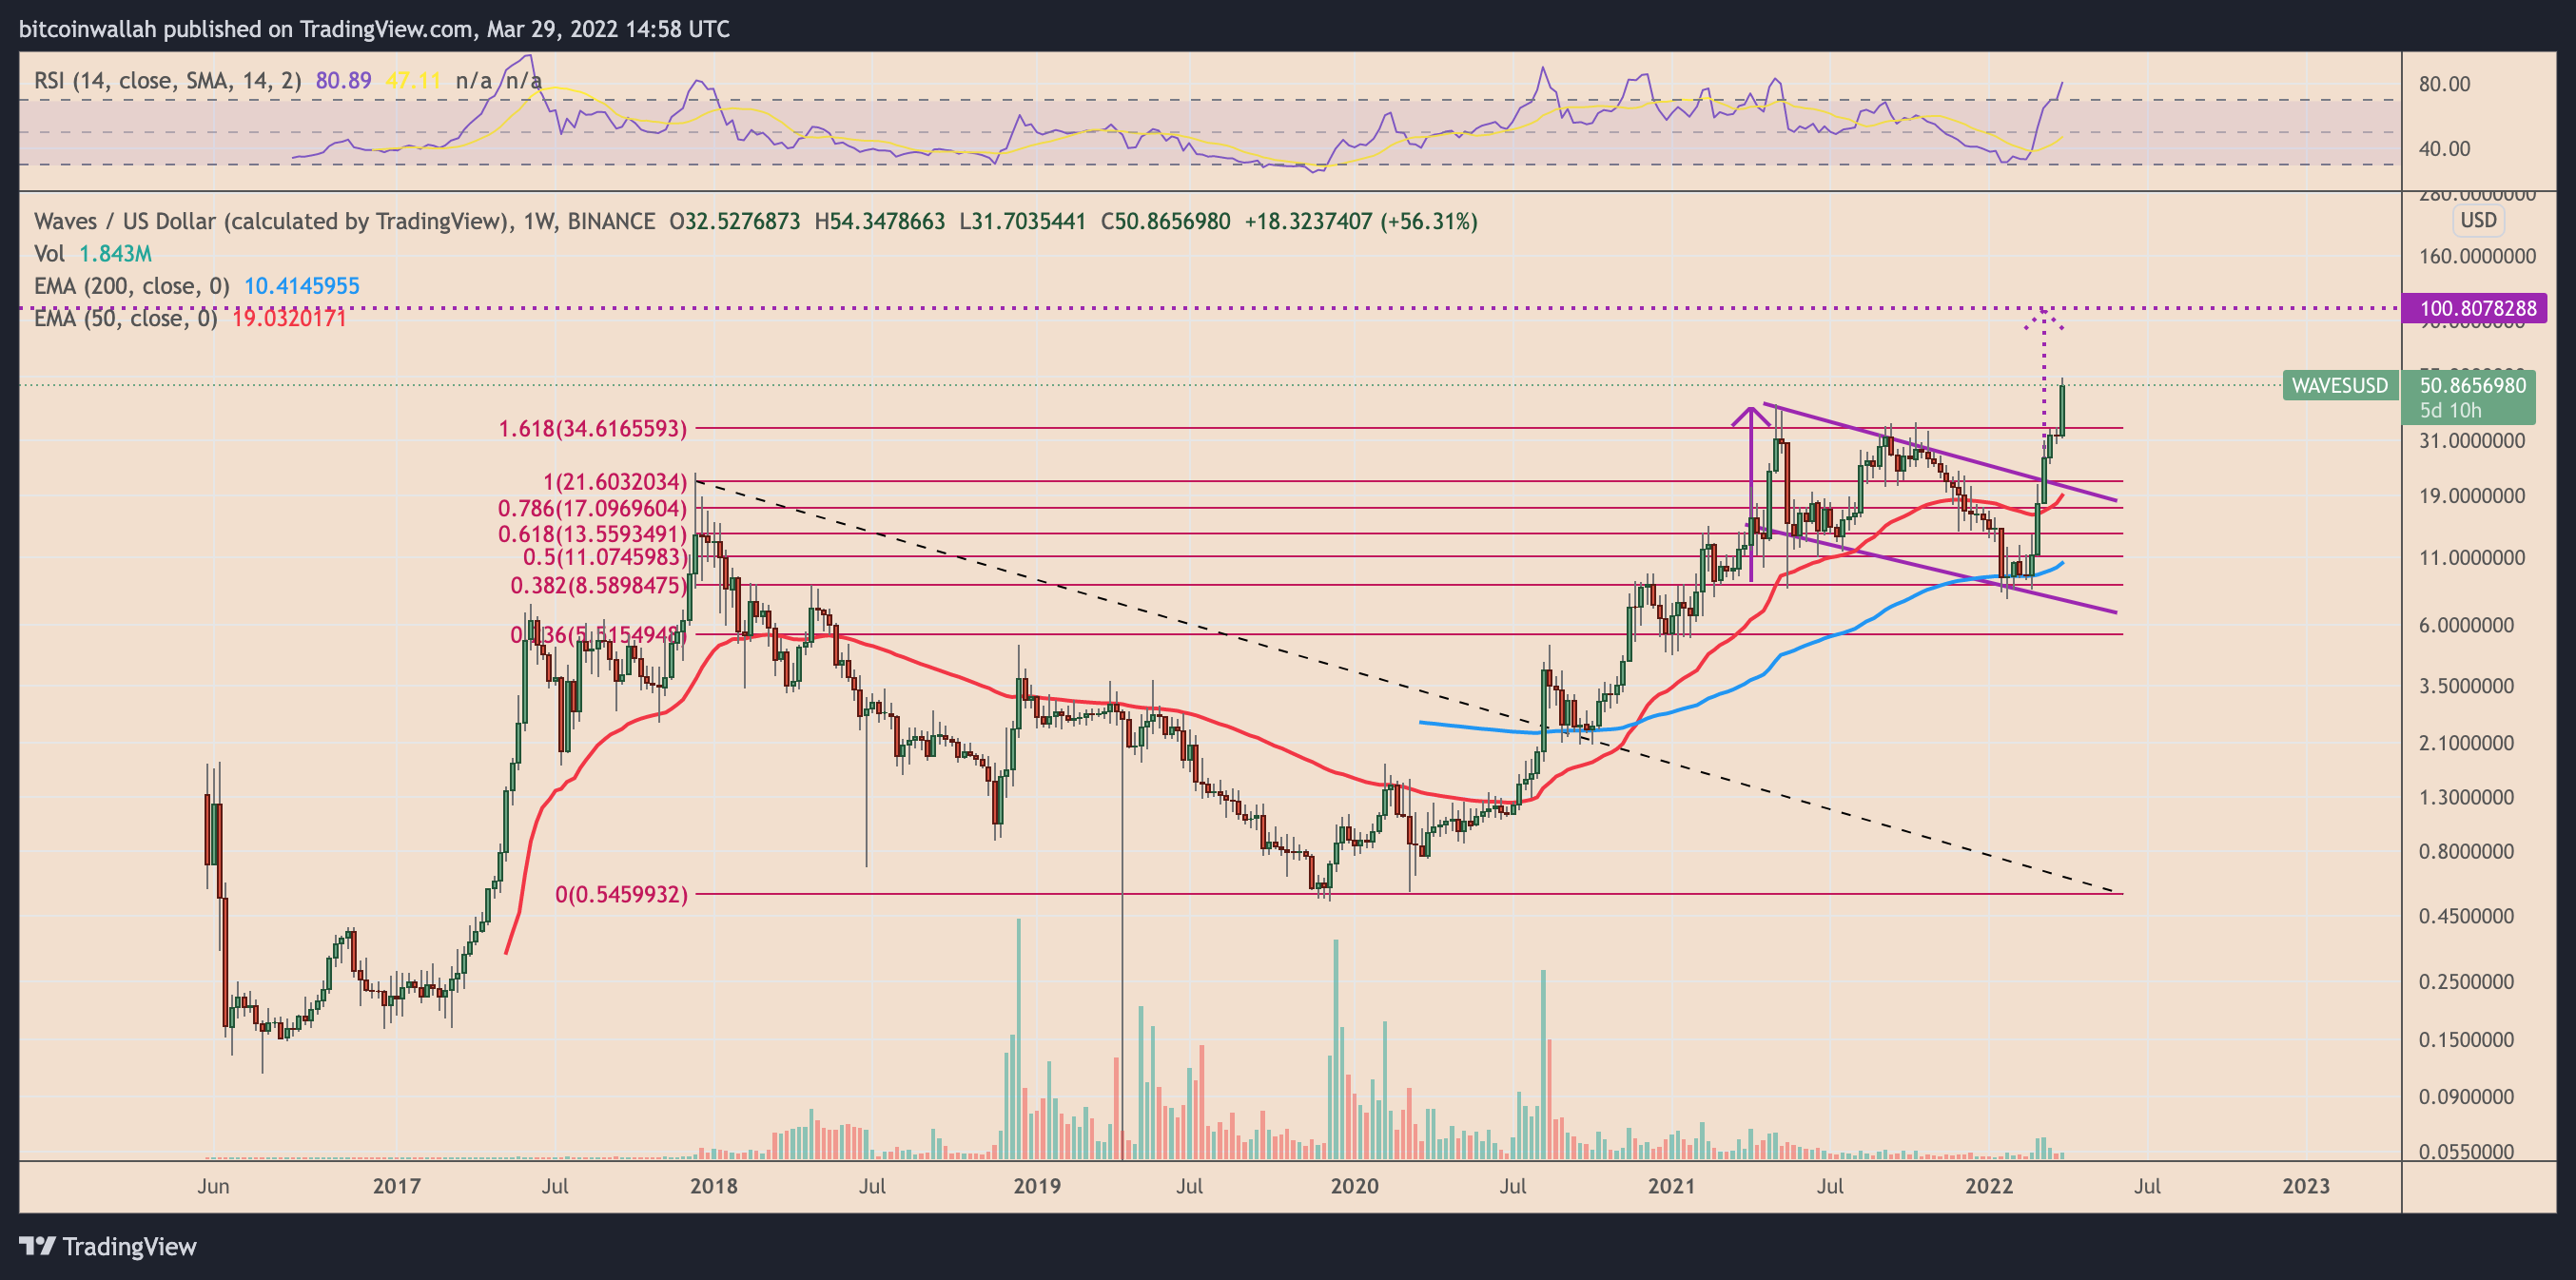
WAVES price surged by up to 70% on March 29, reaching a new all-time high around $54. Traders betting against the rise of Waves — the native token of the WAVES blockchain network — suffered losses worth millions of dollars as the WAVES/USD pair extended its recovery to a record level in the past 24 hours.
The price rebound, which started on Feb. 22 when WAVES price was at $8.25 caused around $13.75 million worth of liquidations due to crypto-based futures on a 24-hour adjusted timeframe, data from Coinglass shows.

2.0 hype, Neutrino behind WAVES rally
As Cointelegraph earlier covered, traders may have jumped into the WAVES market after assessing its three consecutive optimistic updates: the migration to Waves 2.0, the launch of a $150 million fund, and partnership with Allbridge.
Edson Ayllon, product manager at dHEDGE — a decentralized asset management platform, told Cointelegraph that the euphoria surrounding the release of Waves 2.0 in October was reflective in the rising total value locked (TVL) in the Waves ecosystem that reached an all-time high of $4.36 billion on March 29.
“Waves 2.0 adds EVM support to the execution layer, and adds Proof-of-Stake with sharding to the consensus layer,” the analyst noted, adding:
“Sharding and Proof of Stake have been concepts Ethereum has been working towards for years on their roadmap.”
Interestingly, Neutrino, an algorithmic price-stable “assetization” protocol built atop the Waves blockchain, appeared largely behind the increasing Waves TVL.
Notably, the protocol witnessed an inflow of 8.91 million WAVES in one day — worth nearly $450 million — to its smart contract, data from Defi Llama shows.

The supply of USDN increased from around 800 million to 832 million on a 24-hour adjusted timeframe, coinciding with the rise in the WAVES inflow into the Neutrino smart contract. That presented Neutrino as one of the active WAVES buyers in the past 24 hours.

WAVES appears to have been breaking out of a bullish continuation pattern called a “bull flag.”
In detail, the chart pattern looks like a downward sloping channel that appears after a strong price move upward (called “flagpole”). In a perfect scenario, it resolves by breaking out toward the level at a length potentially equal to the flagpole’s size.
Related: Here’s how traders were alerted to RUNE’s, FUN’s, WAVES’ and KNC’s big rallies last week
Applying the classic interpretation of the bull flag pattern to WAVES’ ongoing price action suggests a continued price rally toward $100, as shown in the chart below.

As a result, a continued selloff below $17 would risk invalidating the entire flag setup.
The views and opinions expressed here are solely those of the author and do not necessarily reflect the views of Cointelegraph.com. Every investment and trading move involves risk, you should conduct your own research when making a decision.


Leave A Comment