Bitcoin (BTC) surged to a new all-time high today, hitting close to $67,000. Ether (ETH) also broke above its immediate resistance and has started its march toward the all-time high. This pushed the total market capitalization of the crypto sector to a new all-time high above $2.64 trillion.
The successful debut of the ProShares’ Bitcoin Strategy exchange-traded fund (BITO) acted as the trigger to boost sentiment in the crypto space. The ProShares’ ETF trading volume on the first day of the launch exceeded $1 billion, making it the second-most successful ETF debut based on the trading volume on day one.
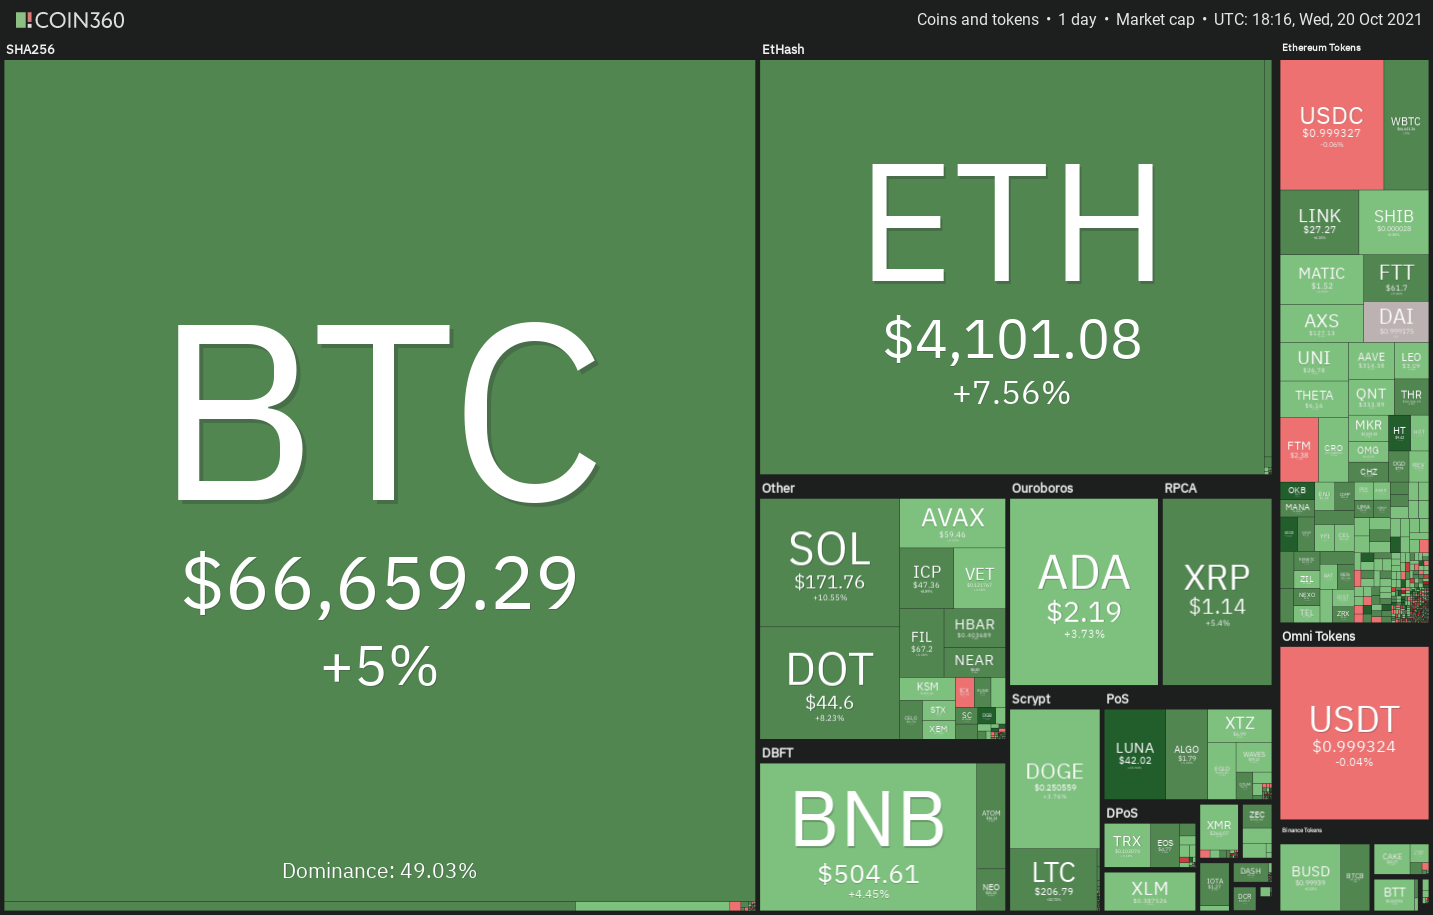
Could Bitcoin piggyback on the positive sentiment created due to the successful launch of the Bitcoin ETF and continue its northward march? Will altcoins also resume their up-move? Let’s study the charts of the top-10 cryptocurrencies to find out.
BTC/USDT
Bitcoin broke above the immediate resistance at $62,933 on Oct. 19 and that was followed by another sharp up-move today, thrusting the price above the previous all-time high at $64,854 made on April 14.
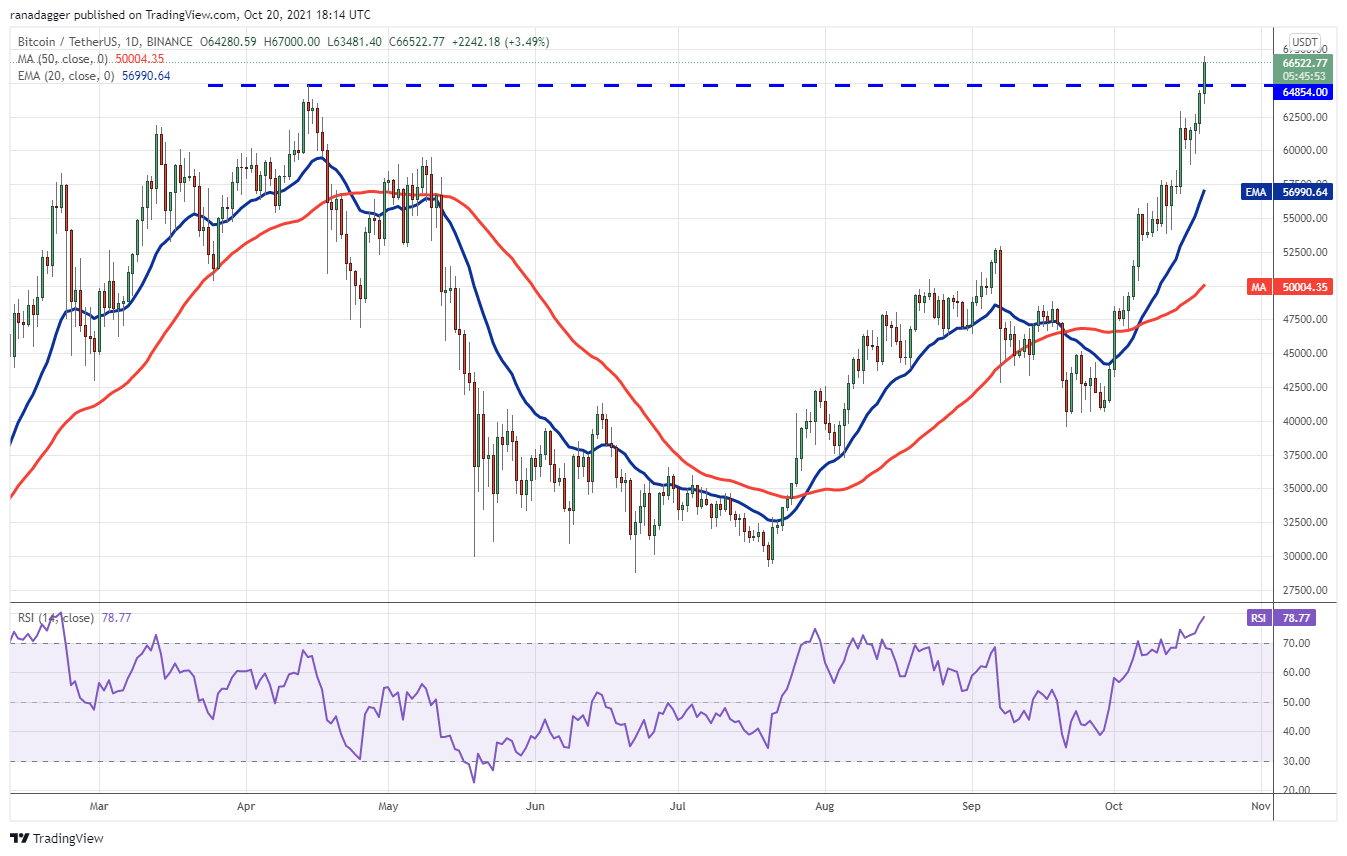
The sharp up-move of the past few days has pushed the relative strength index (RSI) above 78, suggesting that the rally may be overextended in the short term. This could result in a few days of consolidation or a minor correction.
If bulls do not give up much ground from the current level, it will suggest strength and improve the prospects of the continuation of the uptrend.
The critical level to watch on the downside is $60,000. A break and close below this support will be the first sign that traders are aggressively booking profits at higher levels.
ETH/USDT
Ether bounced off the neckline of the inverse head and shoulders (H&S) pattern on Oct. 19, suggesting that bulls are buying on dips to this support. Strong buying has pushed the price above the overhead resistance at $4,027.88 today.
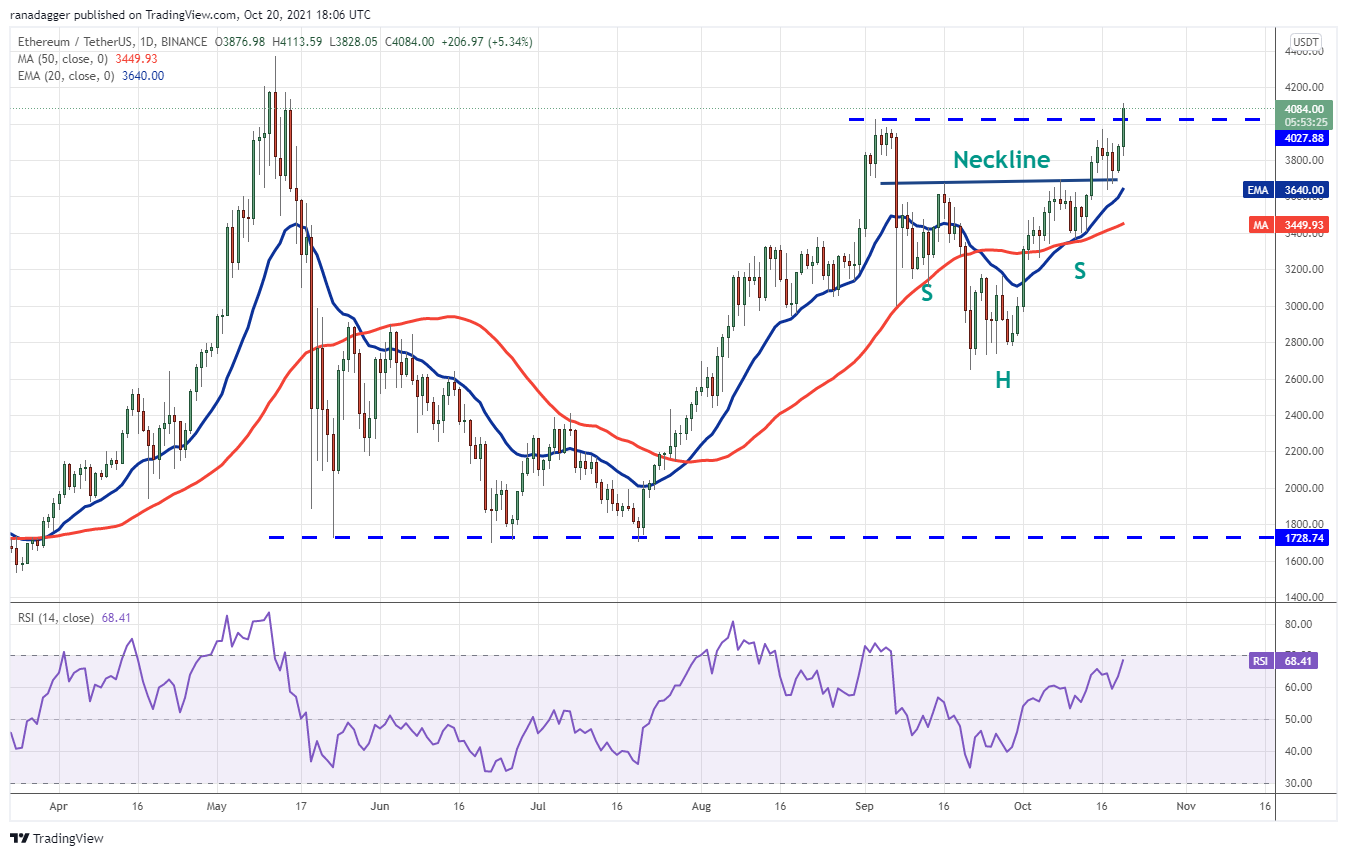
This level may again act as a stiff resistance but if bulls clear the hurdle, the pair could reach the pattern target at $4,657 and then challenge the psychological level at $5,000.
This positive view will invalidate if the price turns down from the current level and breaks below $3,200.
BNB/USDT
Binance Coin (BNB) is gradually moving higher toward $518.90, which had acted as a tough barrier on two previous occasions. Hence, the bears may again try to defend this level with vigor.
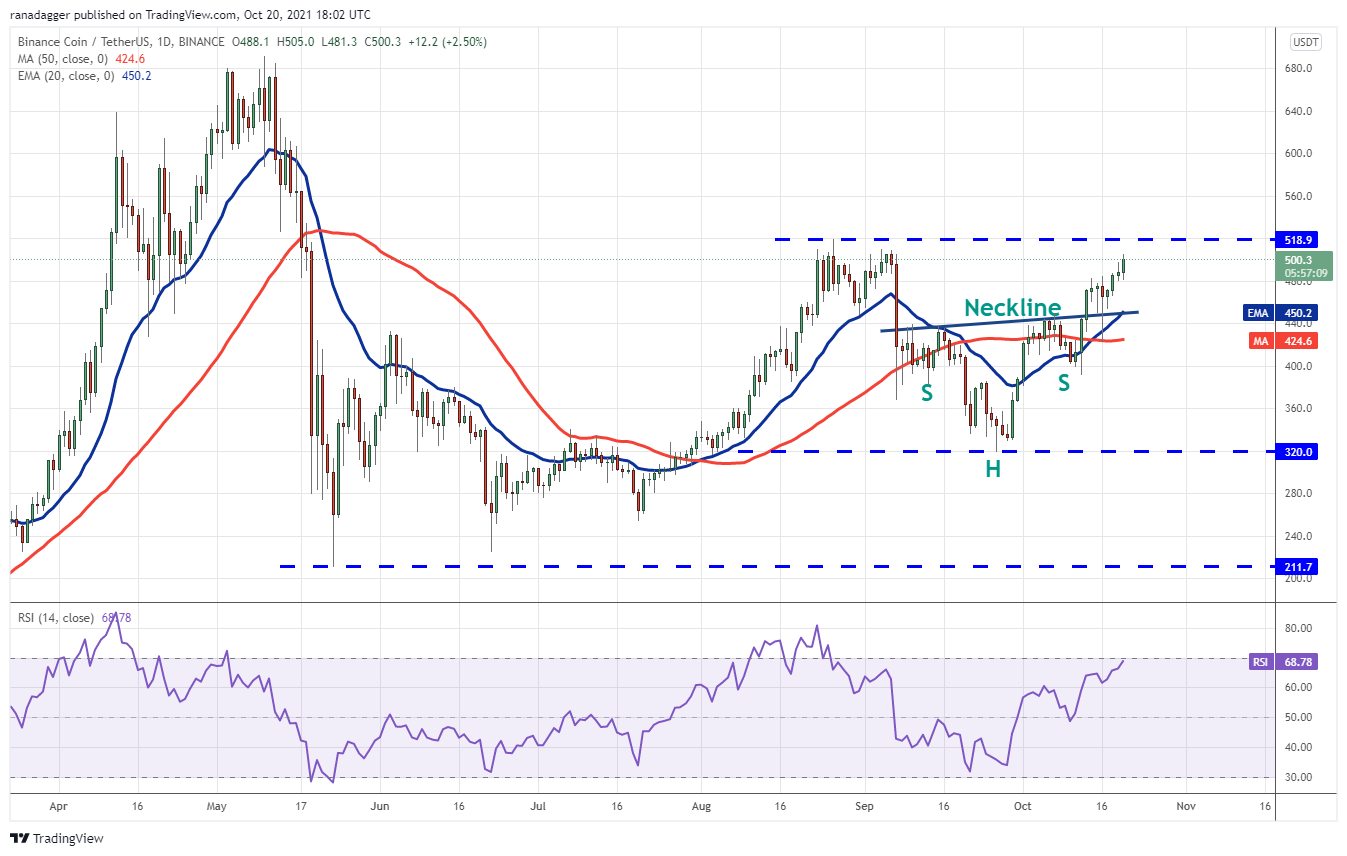
That will increase the likelihood of a break and close above $518.90. The pair could then start its northward march to the pattern target at $554. This bullish view will invalidate if the price turns down and breaks below the right shoulder at $392.20.
ADA/USDT
Cardano (ADA) is attempting to bounce off the support line of the symmetrical triangle pattern. If bulls push the price above the 20-day EMA ($2.19) the altcoin could rally to the resistance line of the triangle.
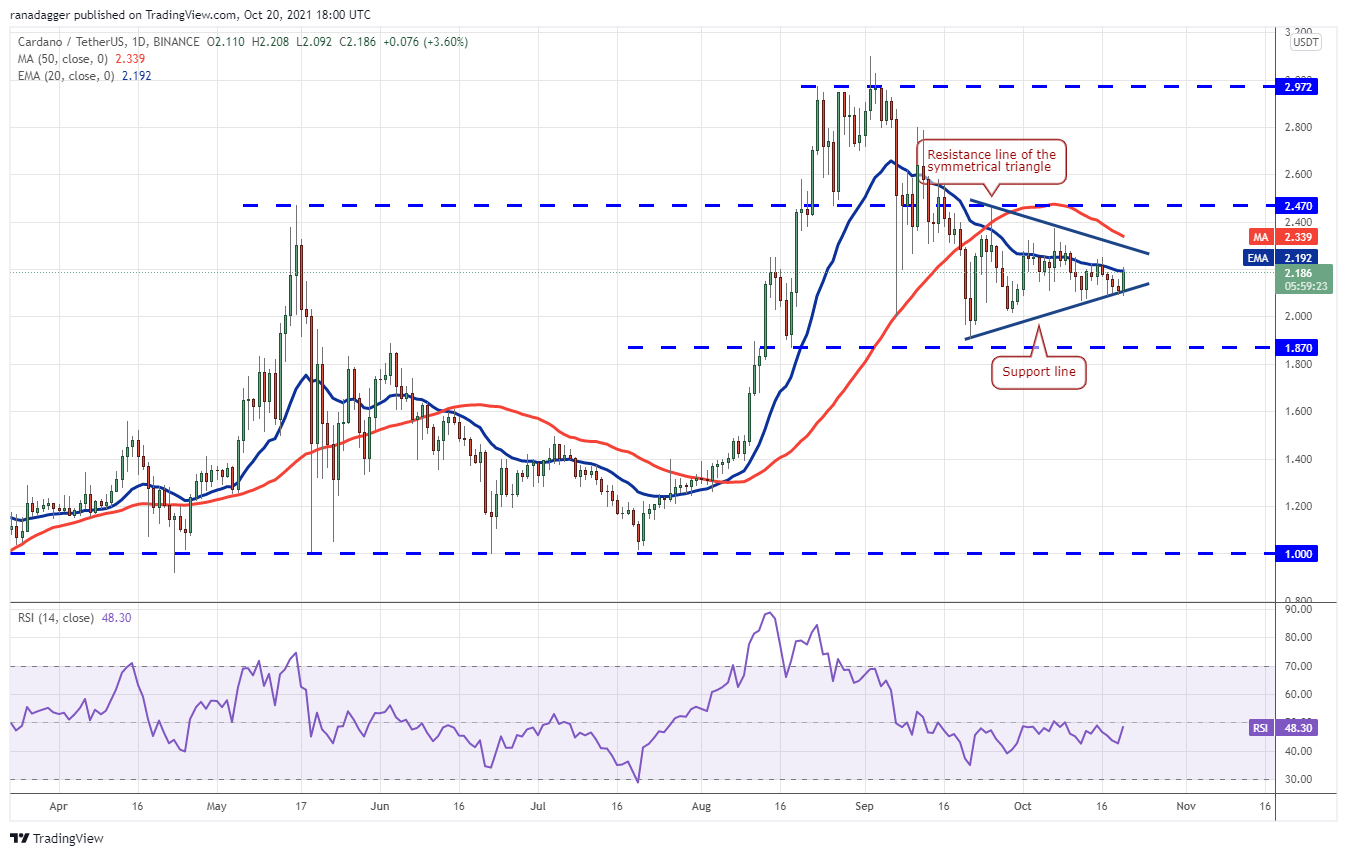
Alternatively, if the price turns down from the current level or the overhead resistance and breaks below the triangle, it will suggest that supply exceeds demand. The pair could then decline to the critical support at $1.87.
XRP/USDT
XRP formed an inside-day candlestick pattern on Oct. 18 and 19, suggesting indecision among the bulls and the bears. This uncertainty resolved to the upside today with a break above $1.10.
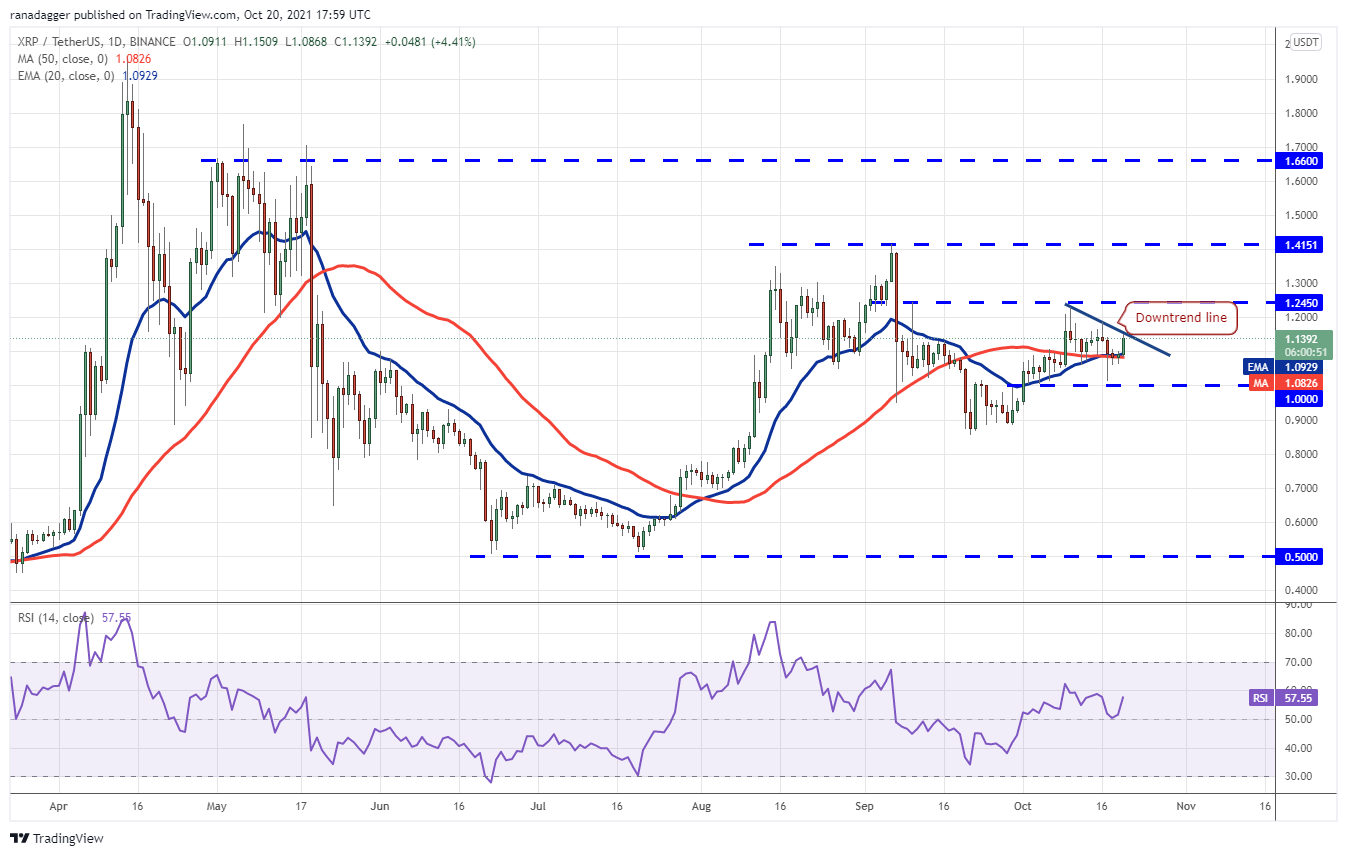
If the price turns down from the downtrend line, the pair could again drop to $1. A break and close below this support will complete a bearish descending triangle pattern that could result in a decline to $0.85.
SOL/USDT
The bulls have successfully defended the moving averages in the past few days, indicating accumulation at lower levels. The buyers will now try to push Solana (SOL) above the overhead resistance zone between $171.47 and $177.79.
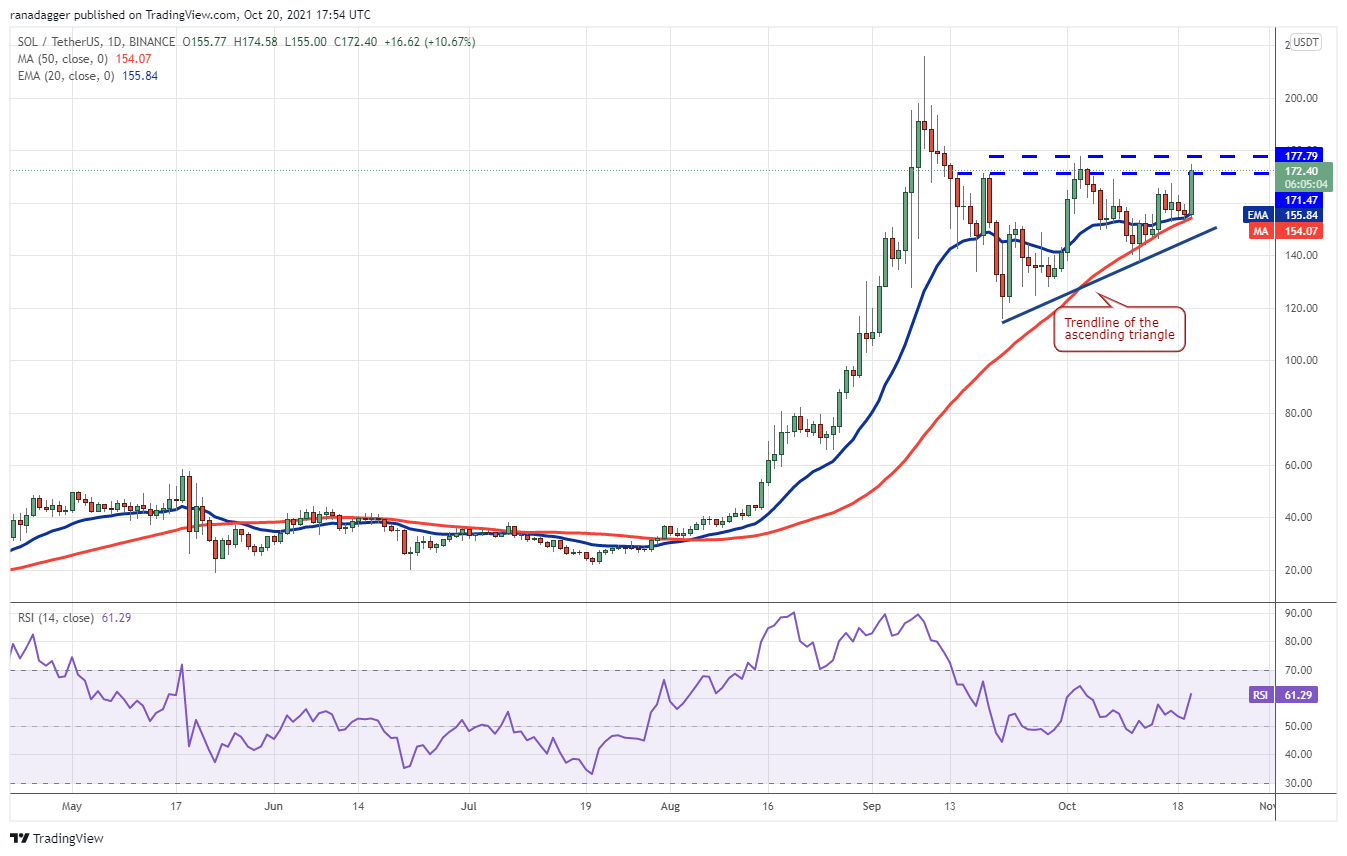
On the other hand, if the price turns down from the current level, it will suggest that bears are aggressively selling on rallies. A break and close below the trendline will invalidate the bullish setup. The SOL/USDT pair could then drop to the critical support at $116.
DOT/USDT
The bulls have successfully held Polkadot (DOT) above the breakout level at $38.77 for the past few days. This suggests strong accumulation by the bulls as they anticipate the rally to resume.
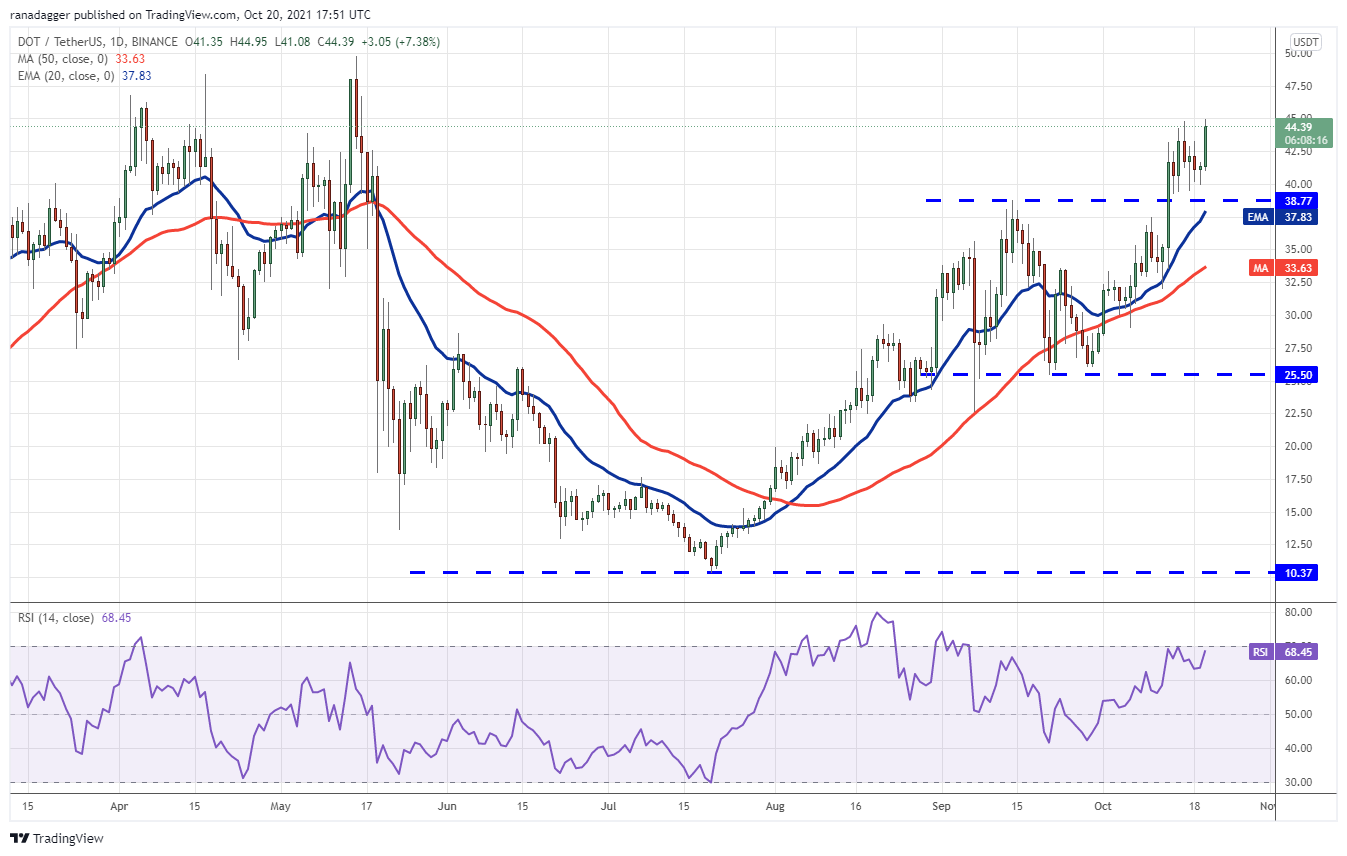
On the other hand, if the price turns down from the current level and breaks below the 20-day EMA ($37.84), it will suggest that bears have made a strong comeback. The DOT/USDT pair could then drop to the 50-day SMA ($33.63).
Related: Cointelegraph Consulting: ETFs listed — What’s next for Bitcoin?
DOGE/USDT
The bulls pushed Dogecoin (DOGE) above the downtrend line on Oct. 18 but could not sustain the higher levels as seen from the long wick on the day’s candlestick. The buyers again tried to clear the overhead hurdle at the downtrend line on Oct. 19 but failed.
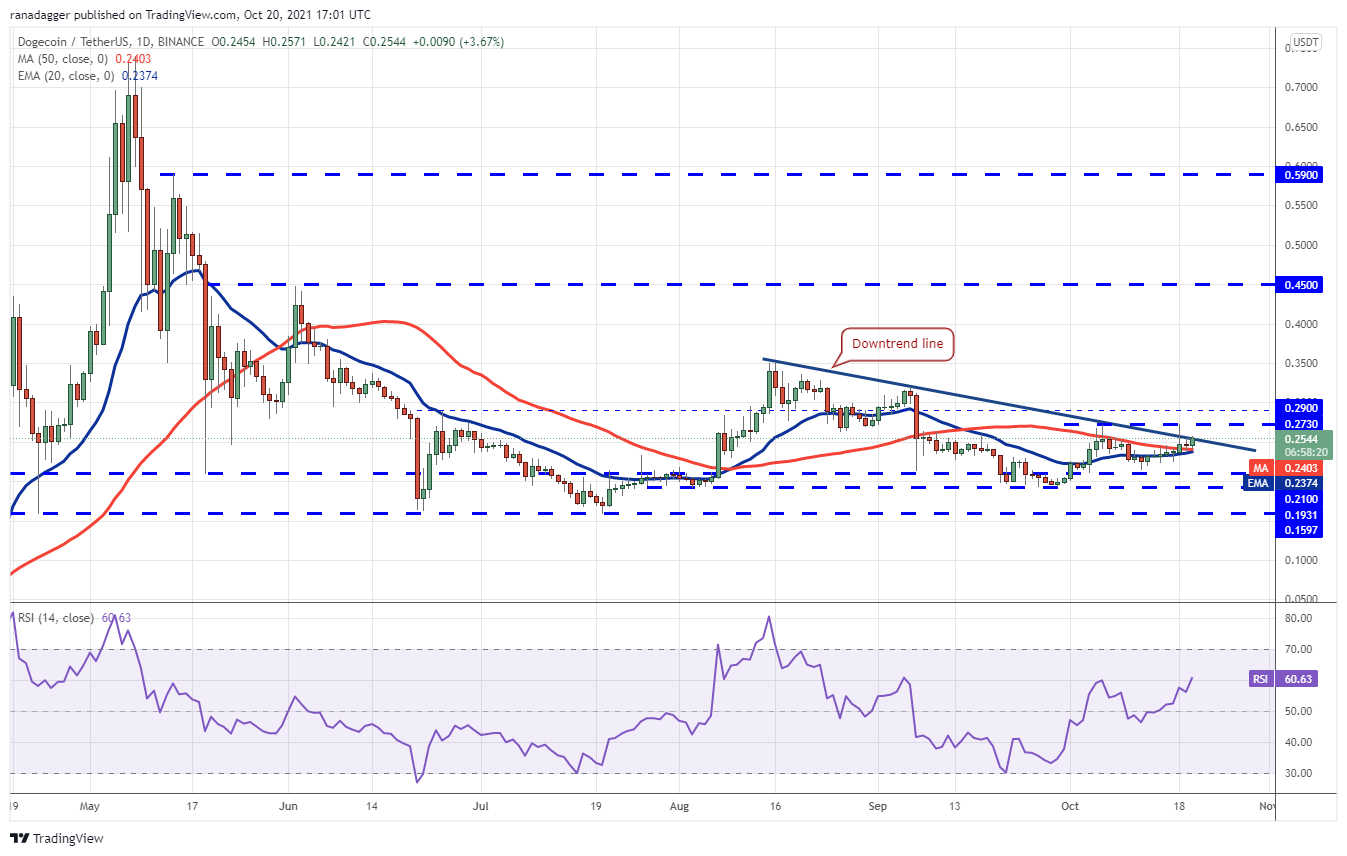
Contrary to this assumption, if the price turns down from the downtrend line and breaks below the 20-day EMA ($0.23), it will suggest that bears are aggressively defending the downtrend line.
If bears sink the price below the 20-day EMA, the DOGE/USDT pair could drop to the strong support zone at $0.21 to $0.19.
LUNA/USDT
Terra protocol’s LUNA token broke below the 50-day SMA ($36.66) on Oct. 17 but the bears could not pull the price below the strong support at $34.86. The failure to do so seems to have attracted buying from aggressive bulls who have pushed the price above the overhead resistance at $39.75 today.
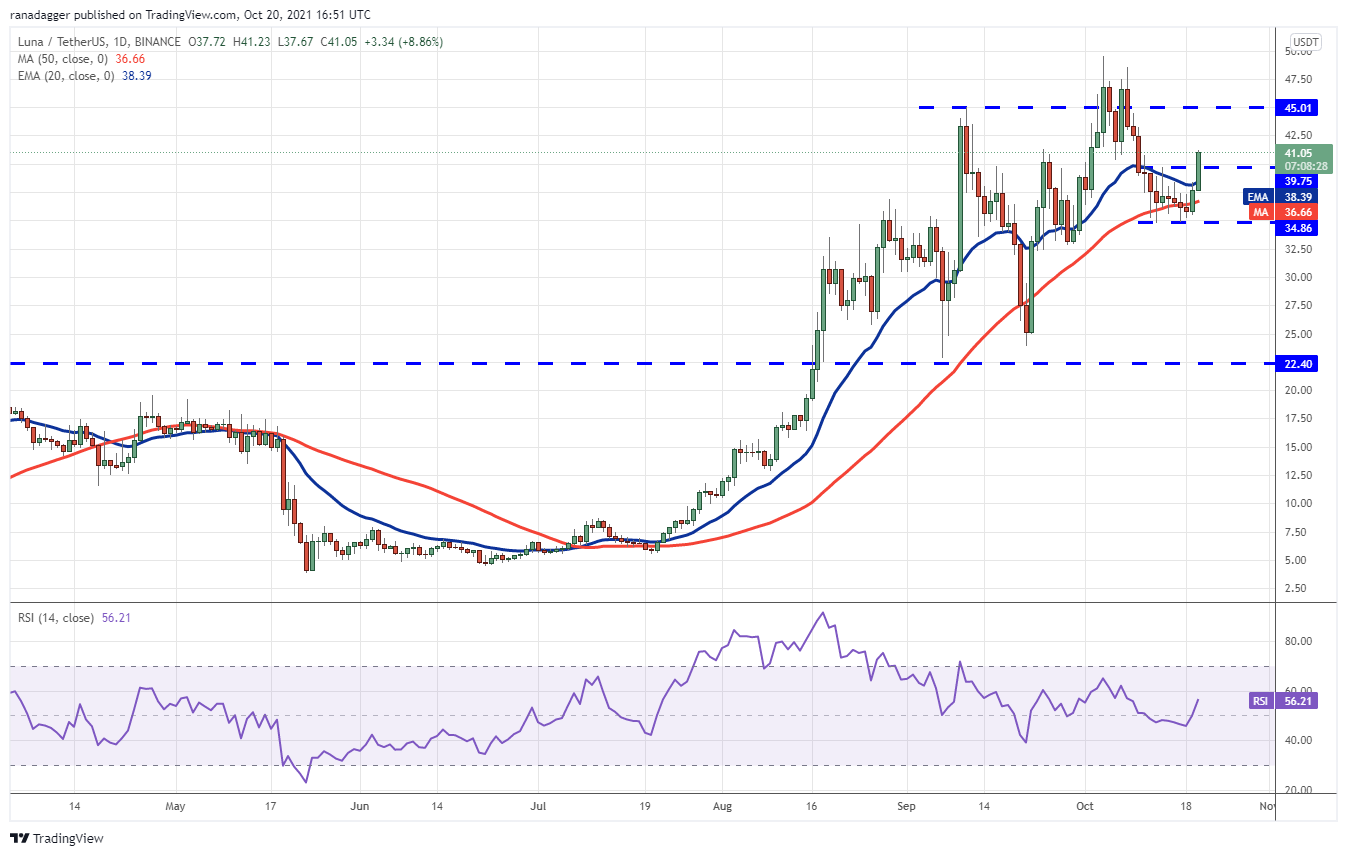
A breakout and close above $45.01 could push the pair to the all-time high at $49.54. On the contrary, if the price turns down from the current level and breaks below $39.75, it will signal strong selling at higher levels. The pair could then drop to $34.86.
UNI/USDT
Uniswap (UNI) has been trading in a tight range between the neckline of the possible inverse H&S and the 20-day EMA ($25.32). This indicates indecision among the bulls and the bears about the next directional move.
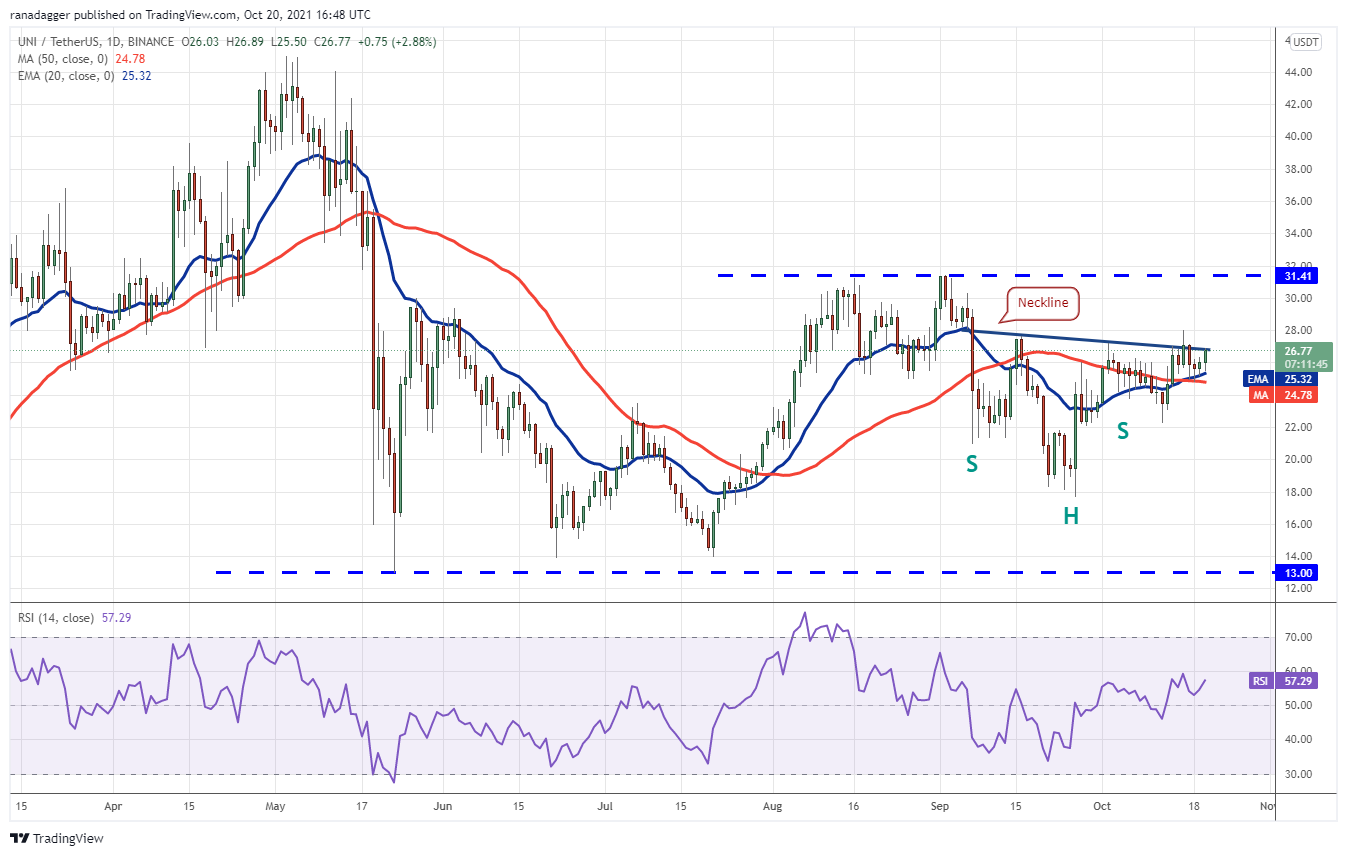
Conversely, if the price turns down from the current level and plummets below the moving averages, the decline may extend to $22. This is an important level for the bulls to defend because a break below it could sink the pair to $18.
The views and opinions expressed here are solely those of the author and do not necessarily reflect the views of Cointelegraph. Every investment and trading move involves risk. You should conduct your own research when making a decision.
Market data is provided by HitBTC exchange.




Leave A Comment