Bitcoin (BTC) bounced back above the psychological level at $50,000 and the S&P 500 hit a new all-time closing high on Dec. 23, suggesting that the panic selling caused due to the omicron variant is subsiding and the much-awaited “Santa rally” may have started.
Data from on-chain analytics firm Glassnode shows that about 100,000 Bitcoin is going from “liquid” to “illiquid” state every month, which means that the coins are being sent to addresses “with little history of spending.” This suggests accumulation by investors.
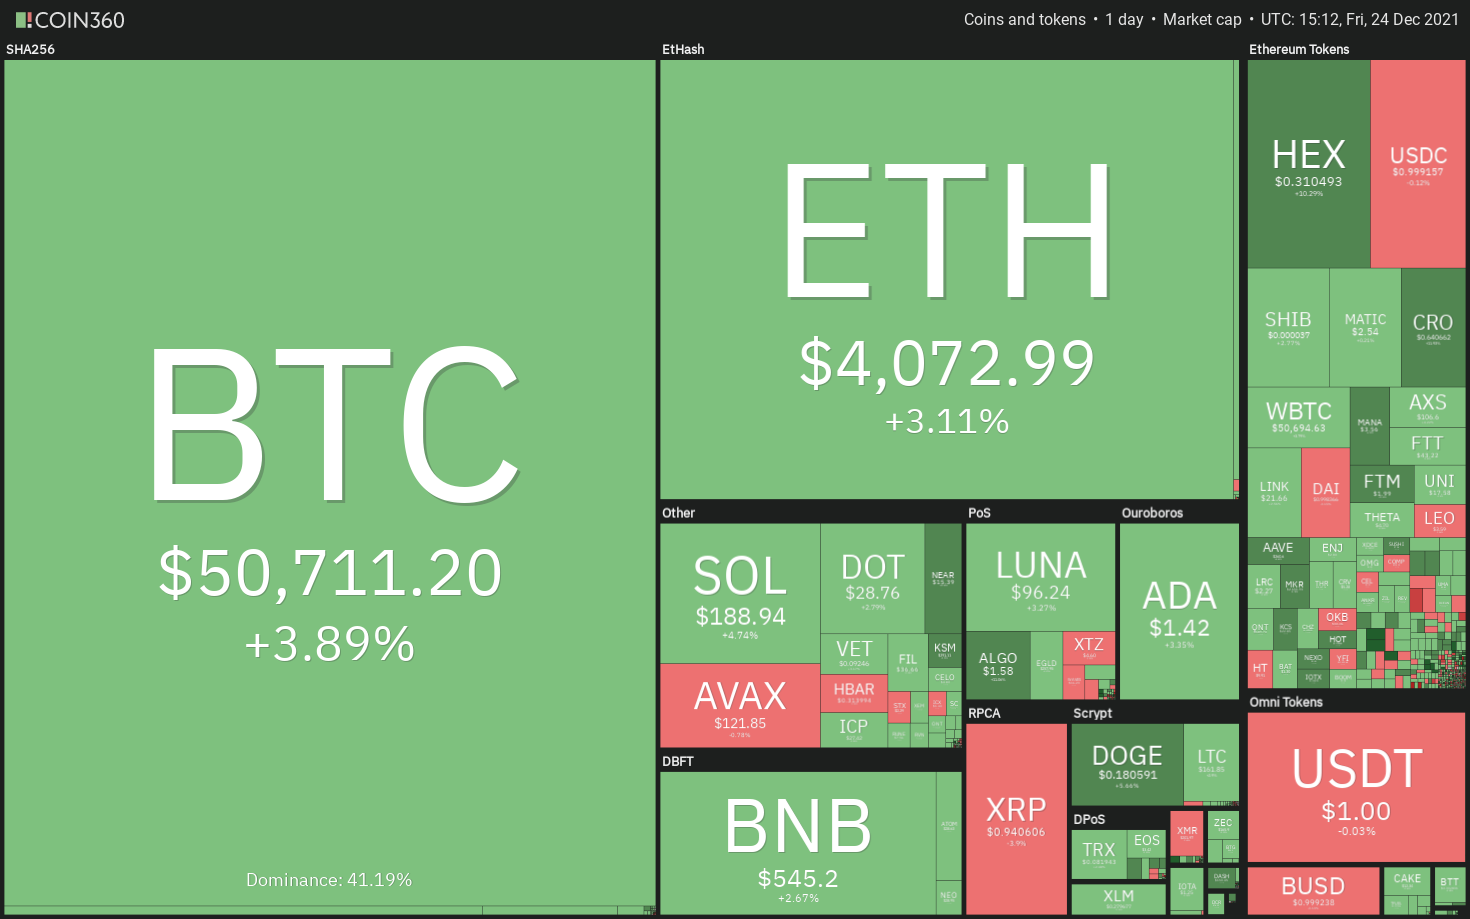
Is the current recovery the start of a new uptrend or is this just a dead cat bounce that will be sold into? Let’s study the charts of the top-10 cryptocurrencies to find out.
BTC/USDT
Bitcoin broke and closed above the 20-day exponential moving average ($49,720) on Dec. 23, indicating that the sellers may be losing their grip. The flattening 20-day EMA and the relative strength index (RSI) near the midpoint suggest a possible change in the short-term trend.

A break and close below the strong support zone at $45,000 to $42,000 could open the doors for a possible decline to $30,000. On the other hand, if buyers drive the price above $55,560, the BTC/USDT pair could rise to the 61.8% Fibonacci retracement level at $58,686. A break and close above this level will improve the prospects of a retest of the all-time high.
ETH/USDT
Ether (ETH) broke and closed above the descending channel and the 20-day EMA ($4,060) on Dec. 23, which is the first indication that the correction may be ending.
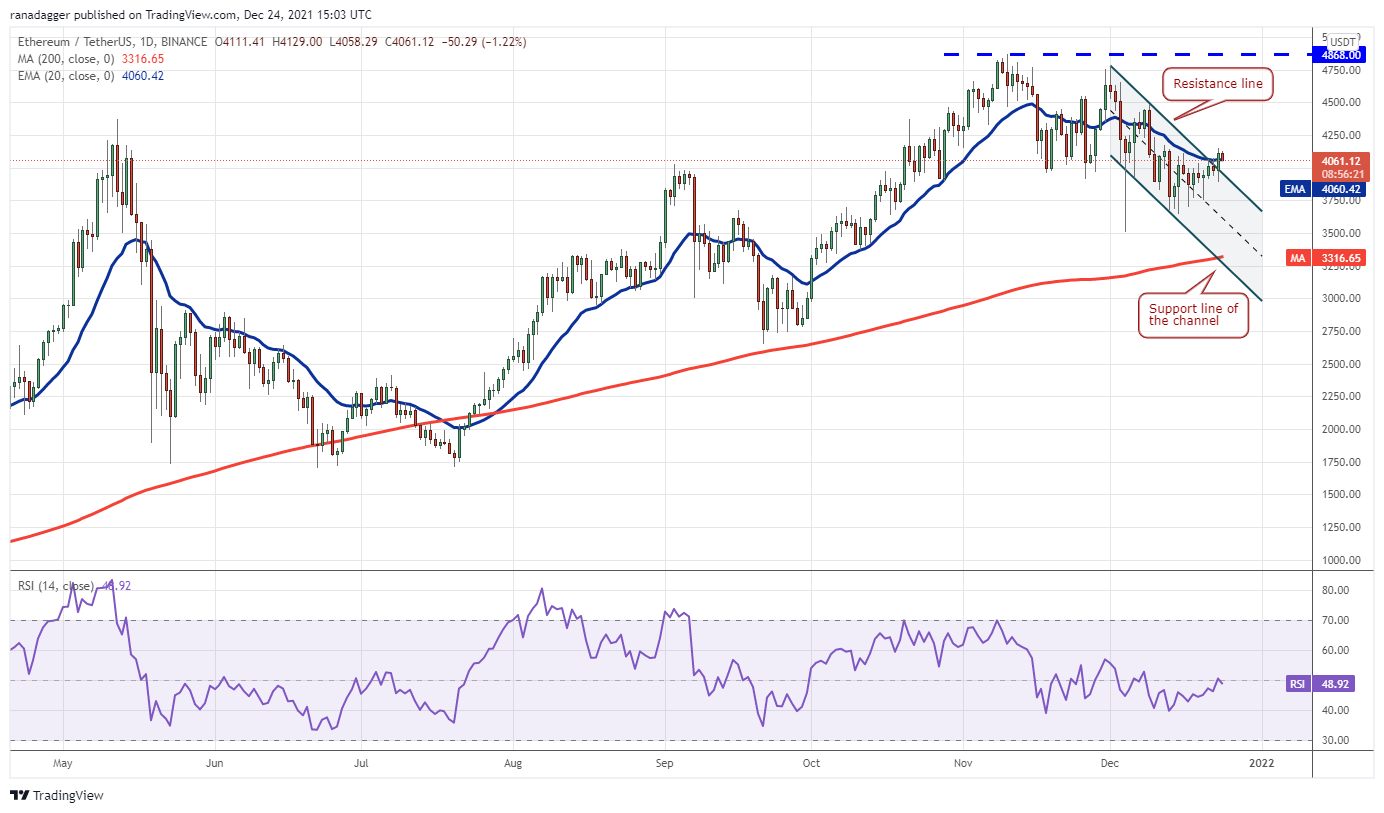
The 20-day EMA is flattening out and the RSI is near the midpoint, suggesting that bulls are attempting a comeback.
However, if the price turns down and breaks back into the channel, it will suggest that the current breakout was a bull trap. The pair could then drop to $3,643.73. A break and close below this support could result in a decline to the 200-day simple moving average ($3,316).
BNB/USDT
Binance Coin (BNB) has recovered to the downtrend line, which could act as a strong resistance. If the price turns down from the current level, it will suggest that traders continue to sell on rallies.
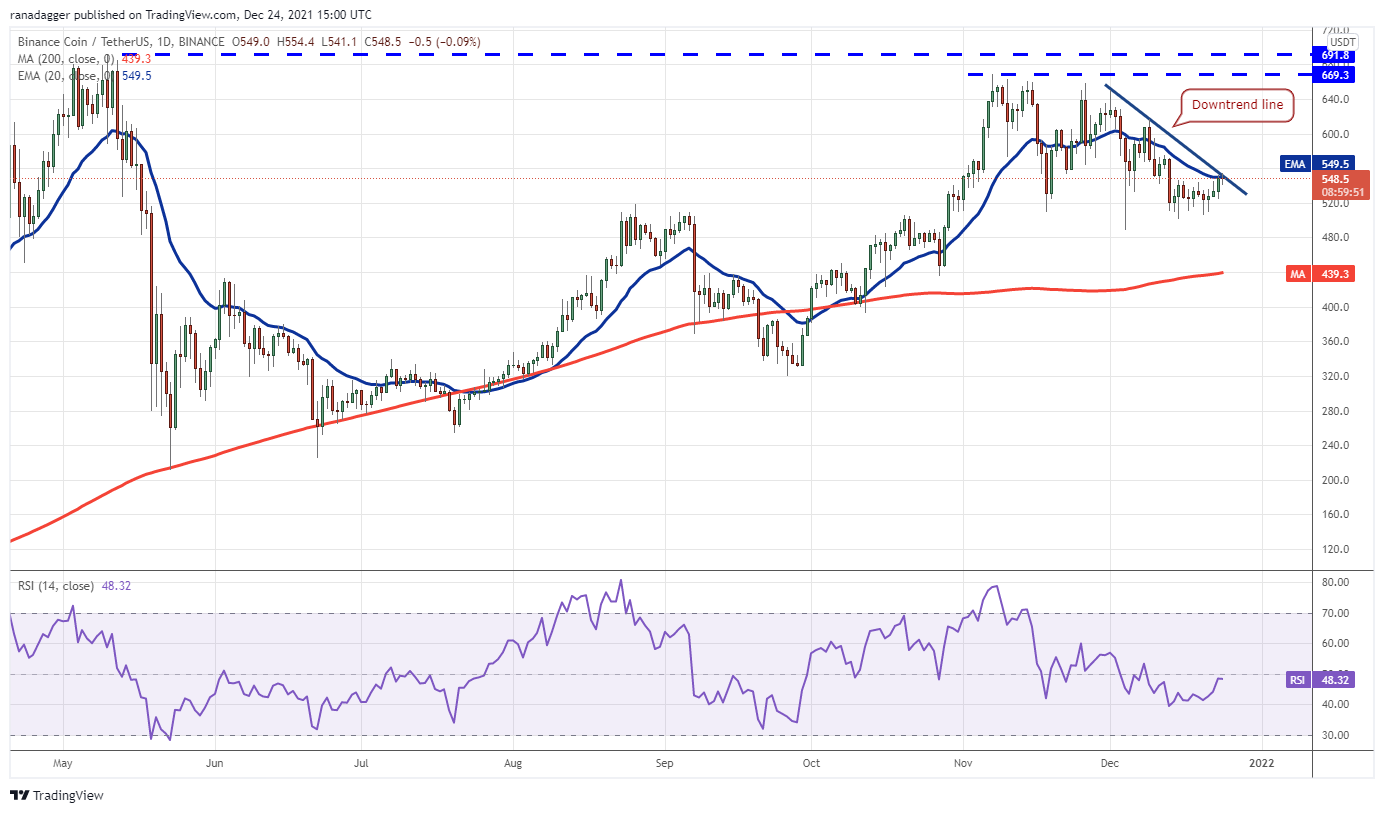
Contrary to this assumption, if bulls drive and sustain the price above the downtrend line, it will suggest that the correction could be over. The buyers will then attempt to resume the up-move, which may face resistance at $575 and later at $617.
SOL/USDT
After trading close to the 20-day EMA ($184) for the past few days, Solana (SOL) broke and closed above the resistance on Dec. 23. The 20-day EMA has flattened out and the RSI is close to the midpoint, suggesting a balance between supply and demand.
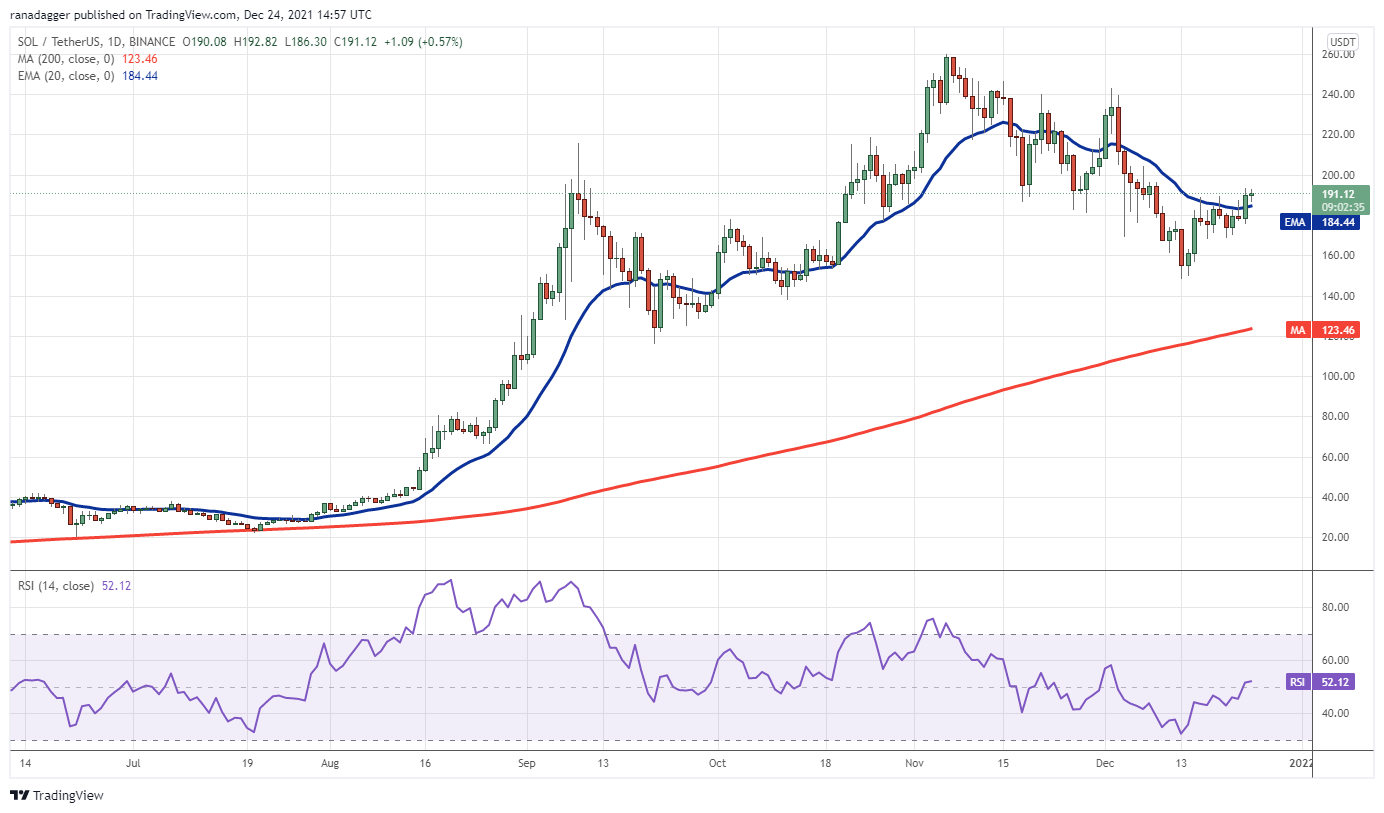
Conversely, if the price turns down and sinks below $168.49, it will suggest that bears continue to sell on rallies. The pair could then drop to $148.04. If this level also cracks, the pair could slump to the 200-day SMA ($123).
ADA/USDT
Cardano (ADA) jumped above the 20-day EMA ($1.37) on Dec. 23, indicating that buyers are attempting a comeback. However, the bears are unlikely to give up easily and will attempt to pull the price back below the 20-day EMA.
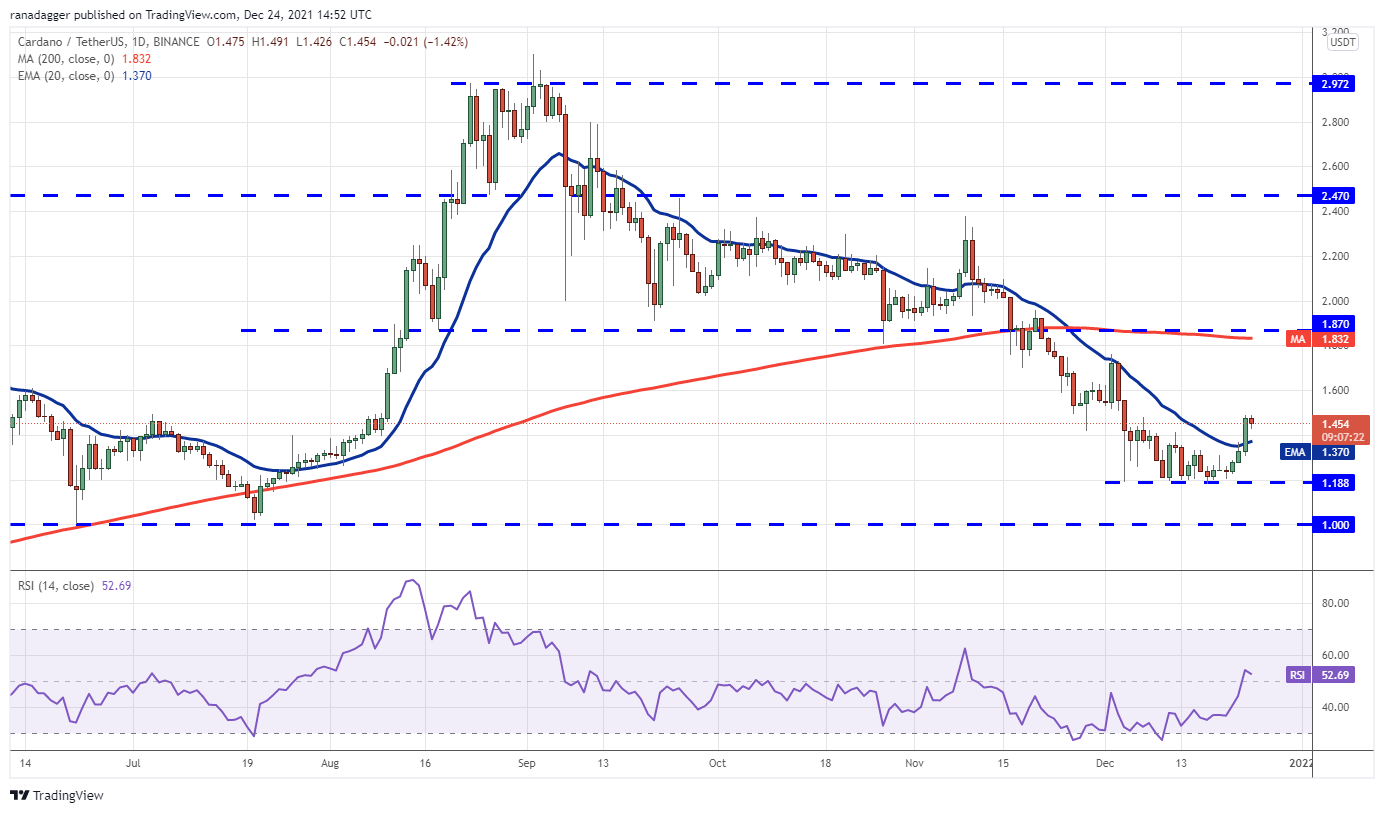
Alternatively, if the price rebounds off the 20-day EMA, it will suggest that the sentiment has turned bullish and traders are buying on dips. The bulls will then attempt to push the price to the overhead resistance at $1.87.
XRP/USDT
XRP broke and closed above the 200-day SMA ($0.94) on Dec. 22, indicating that the sellers may be losing their grip. The bears are currently attempting to stall the recovery near the psychological mark at $1.
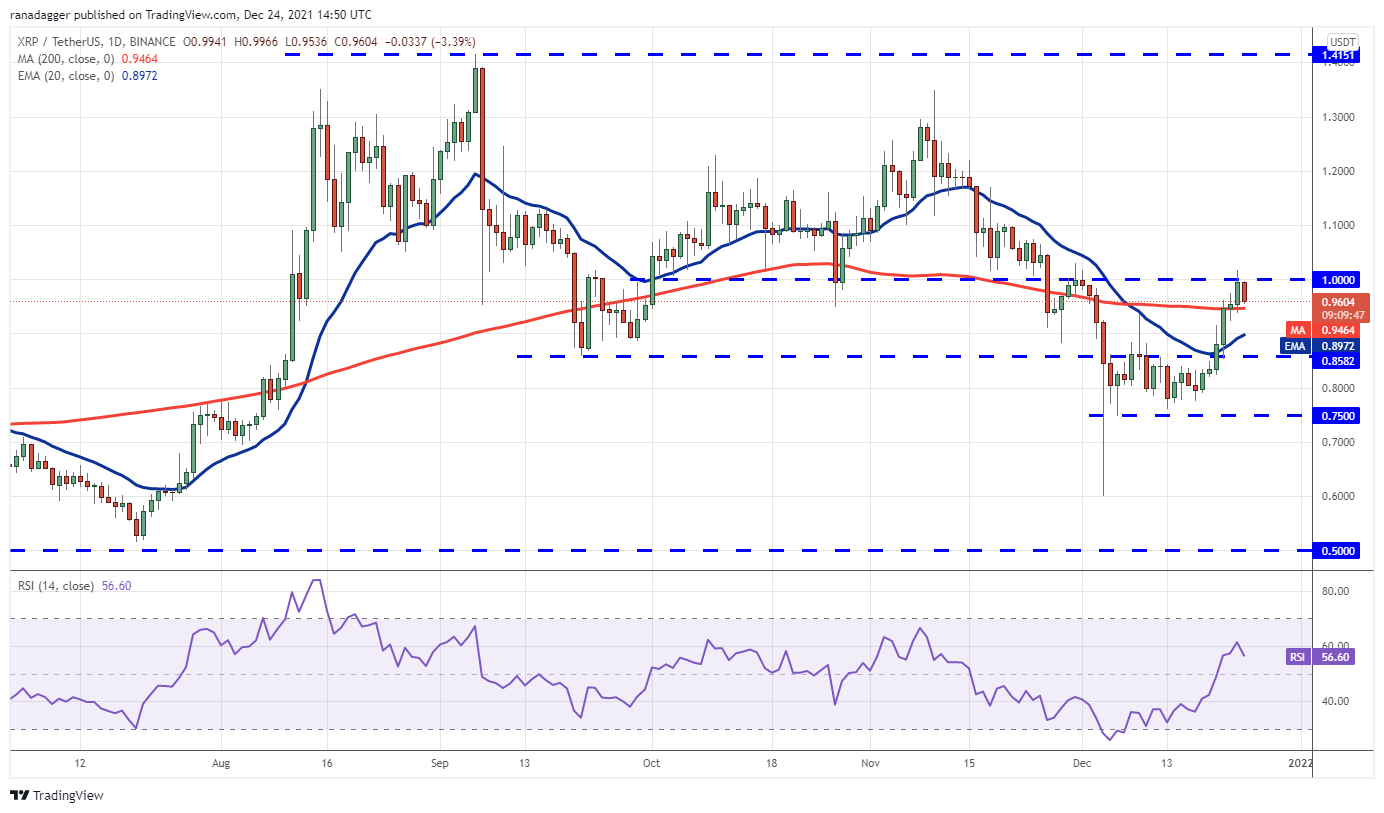
Contrary to this assumption, if the price breaks back below the moving averages, it will suggest that traders are selling near the stiff overhead resistance level. This could keep the pair stuck inside a large range between $0.75 and $1.
LUNA/USDT
Terra’s LUNA token turned down from $98.20 on Dec. 22 indicating that bears are defending the psychological resistance at $100. However, the bulls had other plans as they bought the dip and resumed the up-move on Dec. 23.

Alternatively, if the price turns down from the current level, it will suggest that bears continue to pose a stiff challenge at $100. The selling could intensify if the price plummets below the 20-day EMA. The pair could then drop to $50.
Related: Bitcoin ‘Santa rally’ pauses at $51.5K as funds bet on a sub-$60K BTC price for January 2022
AVAX/USDT
Avalanche (AVAX) has been facing resistance in the zone between the 61.8% Fibonacci retracement level at $119.69 and the 78.6% retracement level at $131.70, but a minor positive is that bulls have not given up much ground.
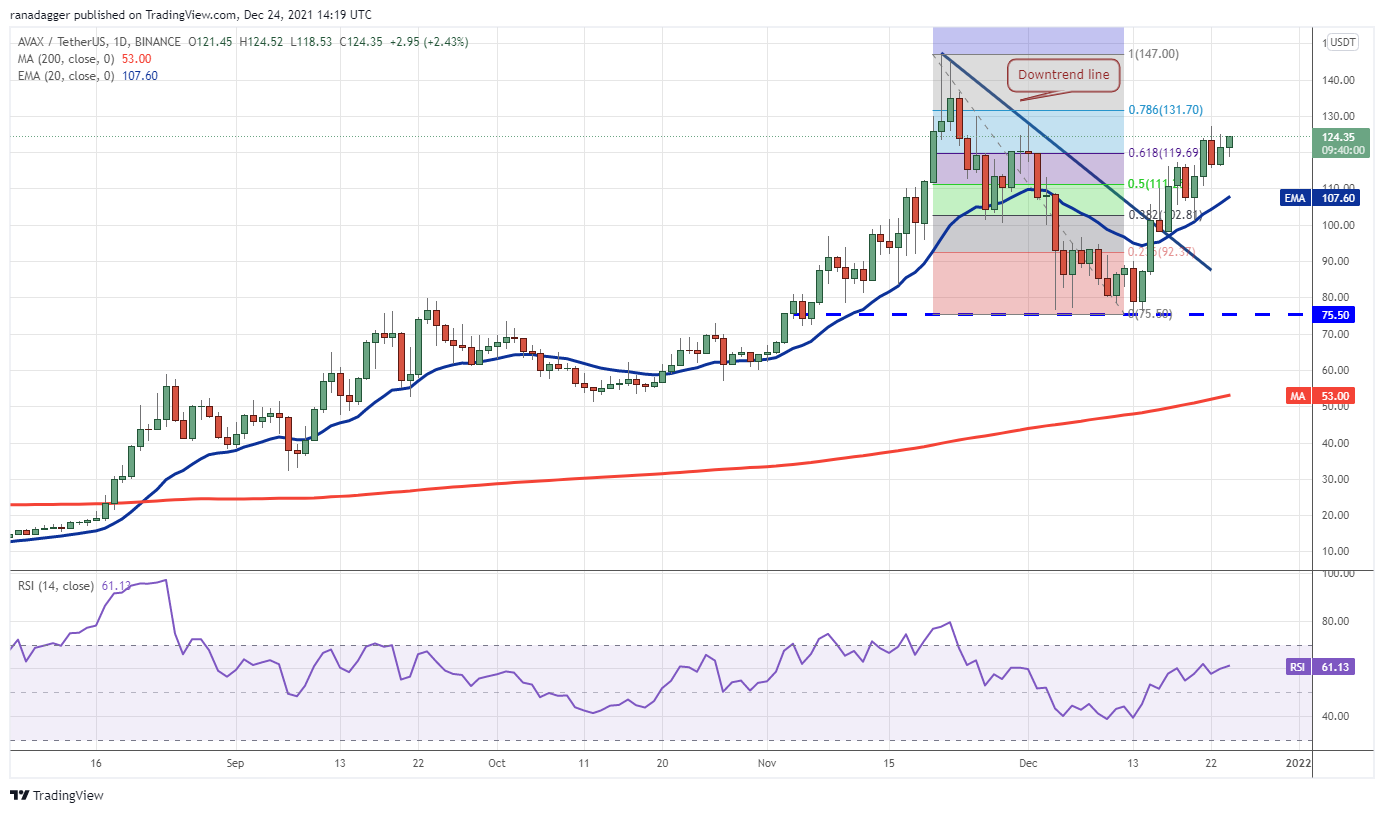
On the contrary, if the price turns down from the current level or the overhead resistance and breaks below the 20-day EMA, it will suggest that demand dries up at higher levels. The pair could then drop to $98.14. If this level cracks, the next stop could be $75.50.
DOT/USDT
Polkadot (DOT) rebounded off the strong support zone at $25 to $22.66 on Dec. 20 and the bulls pushed the price above the moving averages on Dec. 23.

If the price turns down from this level but rebounds off the moving averages, it will suggest a change in sentiment from sell on rallies to buy on dips. That could open the doors for a possible rally to $39.35.
This positive view will invalidate if the price turns down from the current level and breaks below the 20-day EMA ($28.42). That could pull the pair down to the support zone.
DOGE/USDT
Dogecoin’s (DOGE) rebound off the strong support at $0.15 has risen above the 20-day EMA ($0.18). This suggests that the bears may be losing their grip.
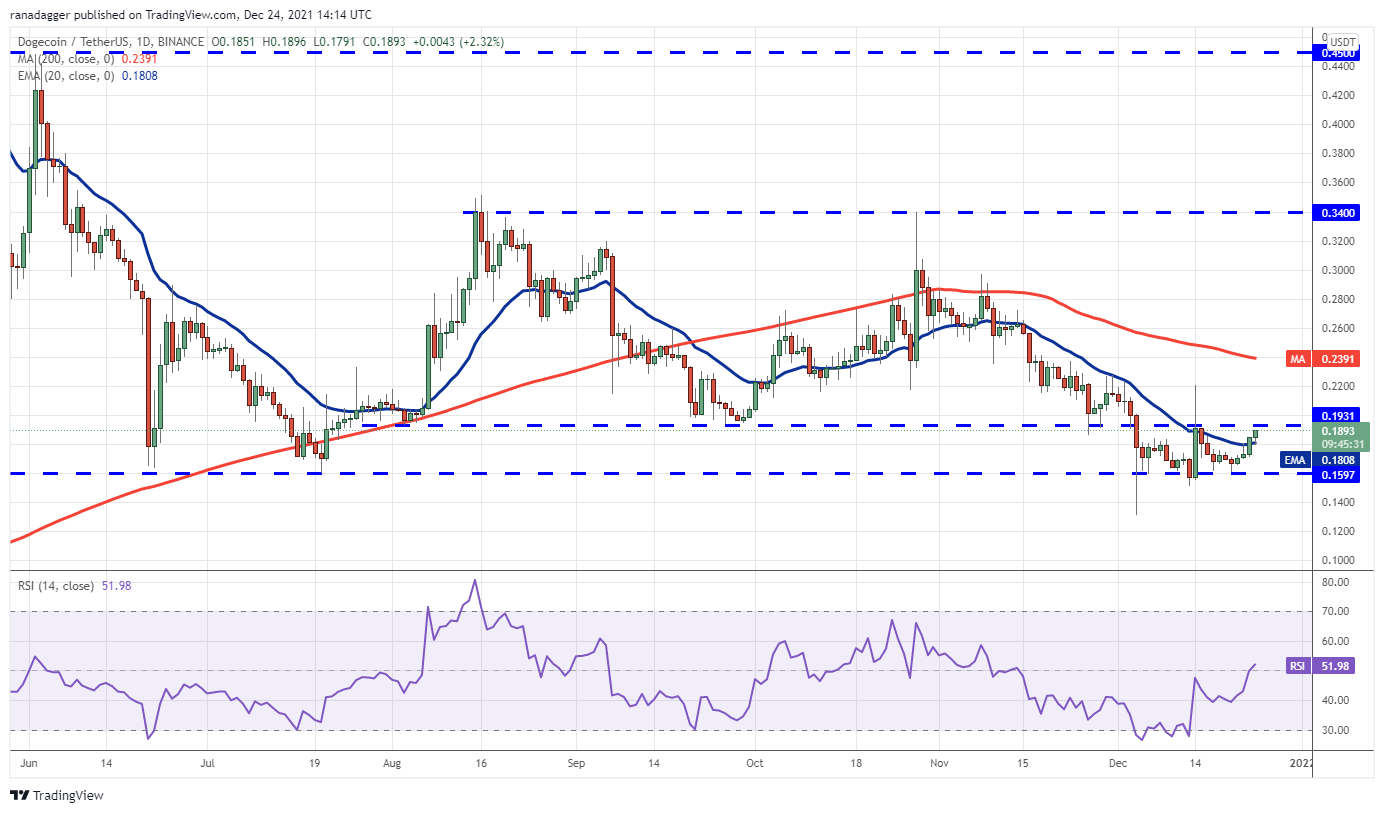
On the other hand, if the price turns down from $0.19, the pair could again drop toward $0.15 and remain range-bound between these two levels for a few more days. The bears will have to sink and sustain the price below $0.15 to start the next leg of the downtrend.
The views and opinions expressed here are solely those of the author and do not necessarily reflect the views of Cointelegraph. Every investment and trading move involves risk. You should conduct your own research when making a decision.
Market data is provided by HitBTC exchange.


Leave A Comment