In stock markets and the crypto sector, traders are always looking for a definite reason to explain an asset’s price action, which means it’s important to stress that correlation doesn’t imply causation.
While it may be easy to connect a regulatory statement or pending legislation to the outcome of an asset’s price, there’s not always hard proof that these were the exact drivers. Some indicators described below may have happened due to pure luck, even if the coincidence continues throughout history.
For example, Bitcoin’s (BTC) pump to $48,200 on Oct. 1 could have been related to the Sept. 30 remarks by the U.S. Federal Reserve chairman Jerome Powell. When asked to clarify his comments on Central Bank Digital Currencies (CBDC), Powell affirmed that the FED has no intentions to ban cryptocurrencies.
Another plausible reason for the current rally is Bitcoin’s 7-day average hash rate jumping to 145 exahashes per second (EH/s), its highest level since the abrupt crash in early June when China’s mining crackdown intensified.
Finally, increasing expectations of a Bitcoin exchange-traded fund (ETF) approval by the U.S. Securities and Exchange Commission (SEC) might have played an essential part in traders’ recent bullish bets.
What is clear is that multiple factors could have led last week’s pump to $49,000, and today bulls appear to be making an effort to recapture $50,000. So let’s take a look at 3 indicators that flashed a ‘buy’ signal ahead of the recent price move.
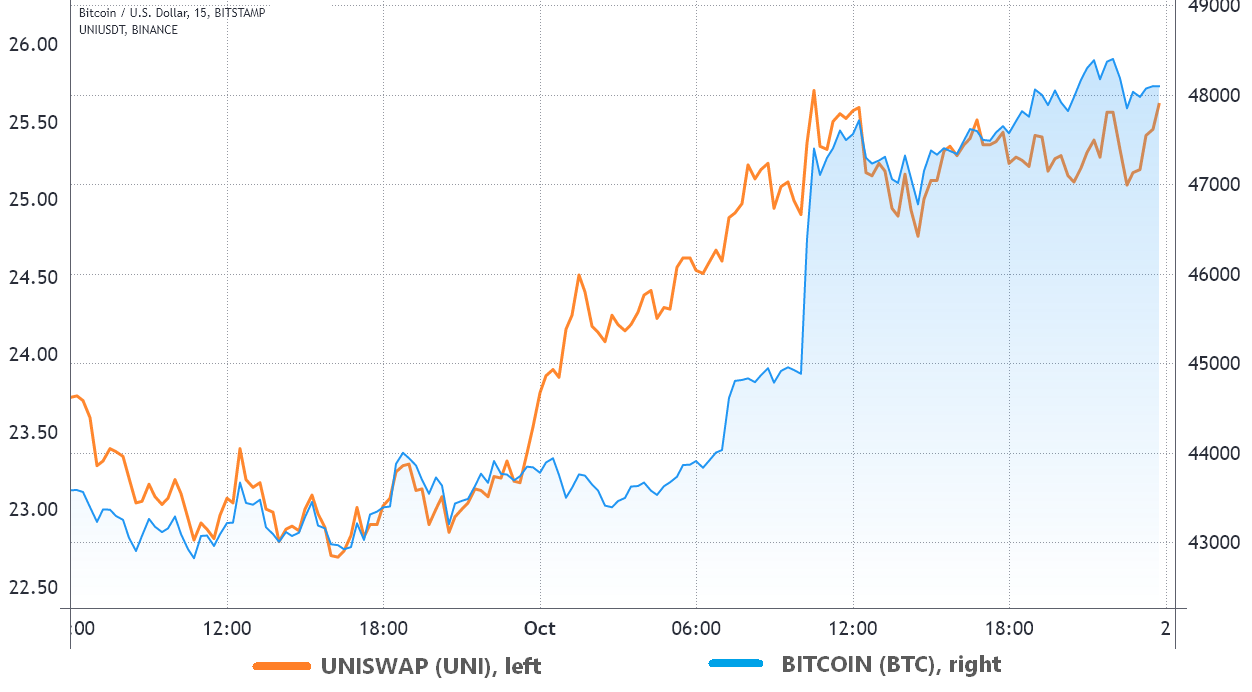
UNI caught a bid after traders turned their attention to DeFi

Curiously, DEX volumes started to soar after China imposed additional restrictions on Bitcoin in the previous week. A reasonable explanation for the move could be investors beginning to understand that China’s action would not impact the trading volume. By migrating to DEX, the possibility for governments to control or limit cryptocurrency adoption goes down significantly.
Shorts on derivatives exchanges saw an uptick
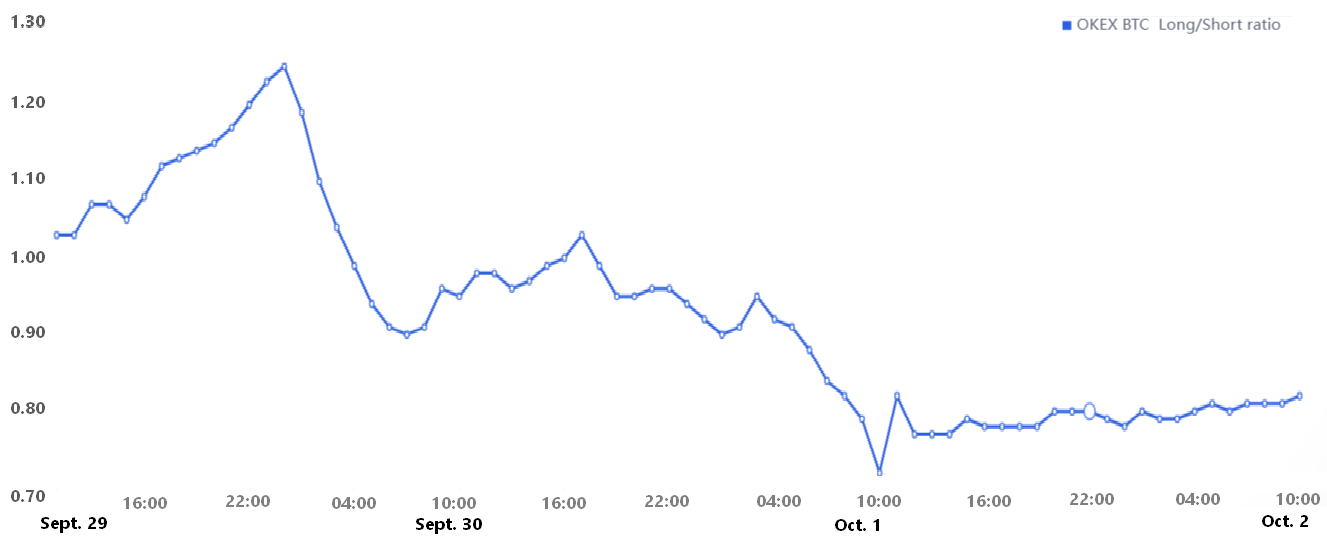
Some exchanges provide useful information on clients’ net exposure by measuring their positions or consolidating data from spot and derivatives markets. For example, the OKEx Bitcoin traders’ long-to-short ratio dropped from 1.25 (favoring longs) to 0.72 (favoring shorts) by 28% in less than two days.
That might sound counterintuitive at first, showing whales increasing bearish bets, but when market expectations are broken, extreme price moves tend to happen. Had most traders expected a positive price swing, the result would likely have been priced in already.

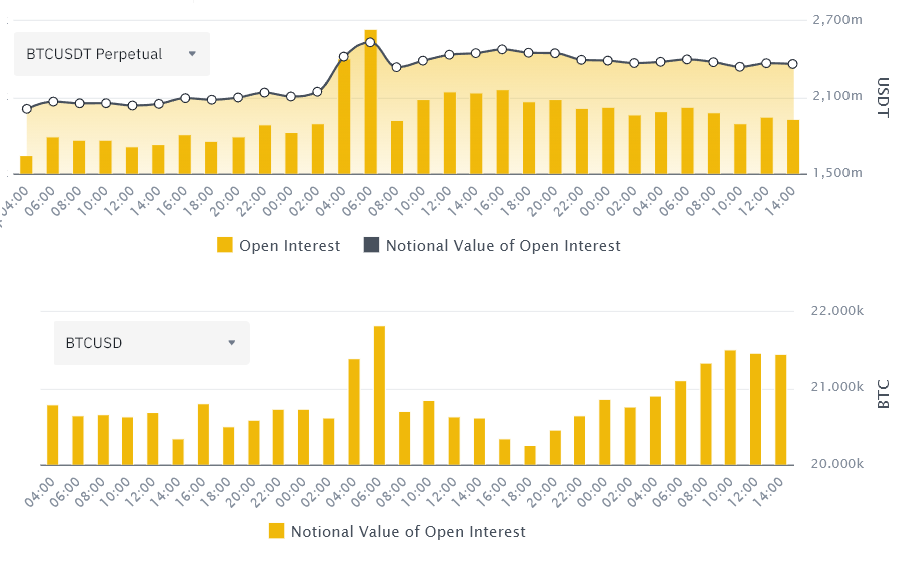
Regardless of the underlying asset, a futures contract has longs (buyers) and shorts (sellers) matched at all times. This means there is no way to anticipate whether those investors are skewed to either side.
However, sudden increases in the open interest, which reflects the aggregate number of contracts still in play, reflects confidence. The higher the notional involved, the bigger the stakes.

The truth is one might never uncover what exactly triggered the rally, but by monitoring similar patterns in the future, traders may be able to predict price pumps. Of course, there’s no guarantee that all three indicators will repeat themselves, but the cost of monitoring the data is minimal.
The views and opinions expressed here are solely those of the author and do not necessarily reflect the views of Cointelegraph. Every investment and trading move involves risk. You should conduct your own research when making a decision.


Leave A Comment